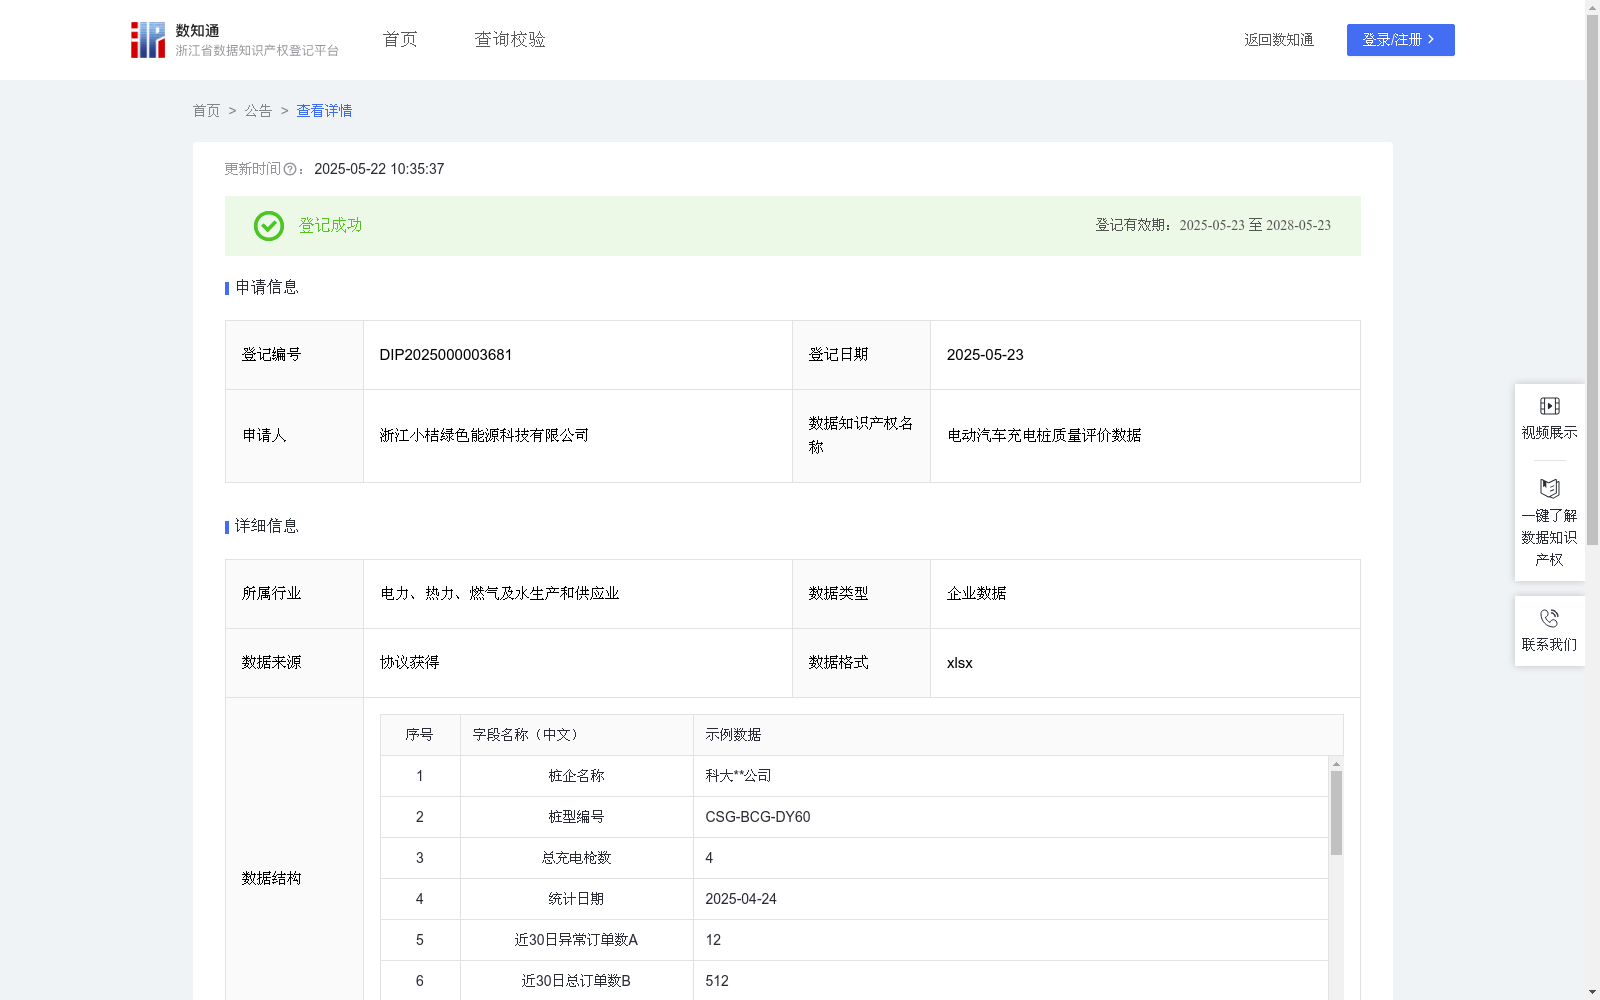
电动汽车充电桩质量评价数据
收藏浙江省数据知识产权登记平台2025-05-22 更新2025-05-23 收录
下载链接:
https://www.zjip.org.cn/home/announce/trends/131814
下载链接
链接失效反馈官方服务:
资源简介:
本数据具有多方位的应用价值,可服务于充电生态中的不同主体。具体应用场景如下:
1、对平台的价值:(1)运营优化:有助于动态调整推荐策略,优先展示评分大于等于80的"优秀"充电桩型号,提升用户充电体验,对评分小于60的充电桩型号实施流量降权或服务限制,减少客户投诉。(2)商业合作:根据桩型质量评价结果制定差异化的平台服务费率政策;作为平台与桩企合作与谈判的重要依据;助力构建场站/商家/桩企设备健康度报告,为投资者提供参考。
2、对场站商家的价值:(1)运维管理:对比不同桩型的质量评分,评估充电桩选型合理性;精准定位高故障风险桩型,制定预防性维护计划。(2)商业决策:作为采购/更新决策的核心指标,优先采购高评分桩型。
3、对桩企的价值(产品改进):对比不同桩型质量评分差异,验证产品迭代效果,针对性开展优化设计。
4、对金融机构的价值:可作为充电基础设施融资的信用评估指标;可支撑充电设备资产证券化(ABS)的估值模型构建。
5、对行业管理部门的价值:为建立行业质量基准,制定充电设备准入标准提供参考依据。1.数据采集:原始数据经授权合法获取并使用,采集桩企名称、桩型编号、总充电枪数、统计日期、近30日异常订单数A、近30日总订单数B、近30日输出电流之和O、近30日需求电流之和D、近30日内被识别功率异常枪数X、近30日内被识别充电异常枪数Y、近30日内被识别不可用枪数Z、近30日内桩企对应型号投入使用的总枪数T等字段;其中,近30日包含统计日期当日。
2.计算反映充电桩设备质量的指标项:近30日异常率=A÷B;近30日满足率=O÷D;近30日内被识别功率异常枪数占比=X÷T;近30日内被识别充电异常枪数占比=Y÷T;近30日内被识别不可用的枪数占比=Z÷T。
3.建立充电桩设备质量评价模型:(1)计算质量评分:Q=[(1-近30日异常率)×0.3+近30日满足率×0.25+(1-近30日内被识别功率异常枪数占比)×0.15+(1-近30日内被识别充电异常枪数占比)×0.15+(1-近30日内被识别不可用的枪数占比)×0.15]×100。(2)评价规则:Q∈[80,100],优秀(优先推荐使用);Q∈[70,80),良好(维持原样);Q∈[60,70),一般(加强观察);Q∈[0,60),差(限制服务)。
This dataset possesses multi-dimensional application value, serving various stakeholders within the charging ecosystem. The specific application scenarios are as follows:
1. Value for charging platform operators:
(1) Operational optimization: Helps dynamically adjust recommendation strategies, prioritize displaying "excellent" charging pile models with a score of ≥80 to improve user charging experience, and implement traffic downgrading or service restrictions for pile models with a score <60 to reduce customer complaints.
(2) Business cooperation: Formulate differentiated platform service fee policies based on the quality evaluation results of pile models; serve as an important basis for platform negotiations and cooperation with charging pile manufacturers; assist in constructing equipment health reports for charging stations, merchants and charging pile manufacturers, providing references for investors.
2. Value for charging station merchants:
(1) Operation and maintenance management: Compare the quality scores of different pile models to evaluate the rationality of charging pile selection; accurately identify pile models with high fault risks and develop preventive maintenance plans.
(2) Business decision-making: Serve as a core indicator for procurement/renewal decisions, giving priority to purchasing high-scoring pile models.
3. Value for charging pile manufacturers (product improvement): Compare the quality score differences of different pile models to verify the effect of product iterations, and carry out targeted optimization designs.
4. Value for financial institutions: Can be used as a credit evaluation indicator for financing of charging infrastructure; support the construction of valuation models for charging equipment asset-backed securities (ABS).
5. Value for industry regulatory authorities: Provide reference for establishing industry quality benchmarks and formulating access standards for charging equipment.
1. Data collection: Original data is legally obtained and used with authorization. Collected fields include: charging pile manufacturer name, pile model number, total number of charging guns, statistical date, number of abnormal orders in the past 30 days (A), total number of orders in the past 30 days (B), sum of output current in the past 30 days (O), sum of demand current in the past 30 days (D), number of guns identified with power abnormalities in the past 30 days (X), number of guns identified with charging abnormalities in the past 30 days (Y), number of guns identified as unavailable in the past 30 days (Z), total number of guns of the corresponding model put into use by the pile manufacturer in the past 30 days (T), etc. Note: The "past 30 days" includes the statistical date itself.
2. Calculation of charging pile equipment quality indicators:
- Abnormality rate over the past 30 days = A ÷ B
- Charging satisfaction rate over the past 30 days = O ÷ D
- Proportion of guns identified with power abnormalities in the past 30 days = X ÷ T
- Proportion of guns identified with charging abnormalities in the past 30 days = Y ÷ T
- Proportion of guns identified as unavailable in the past 30 days = Z ÷ T
3. Establishment of charging pile equipment quality evaluation model:
(1) Quality score calculation:
Q = [(1 - abnormality rate over the past 30 days) × 0.3 + charging satisfaction rate over the past 30 days × 0.25 + (1 - proportion of guns with power abnormalities) × 0.15 + (1 - proportion of guns with charging abnormalities) × 0.15 + (1 - proportion of unavailable guns) × 0.15] × 100
(2) Evaluation rules:
- Q ∈ [80, 100]: Excellent (priority for recommendation and use)
- Q ∈ [70, 80): Good (maintain current status)
- Q ∈ [60, 70): Fair (strengthen monitoring)
- Q ∈ [0, 60): Poor (restrict services)
提供机构:
浙江小桔绿色能源科技有限公司
创建时间:
2025-04-27
搜集汇总
数据集介绍
背景与挑战
背景概述
电动汽车充电桩质量评价数据包含591条记录,每日更新,详细记录充电桩性能指标和质量评分,适用于充电生态中的多个主体。
以上内容由遇见数据集搜集并总结生成


