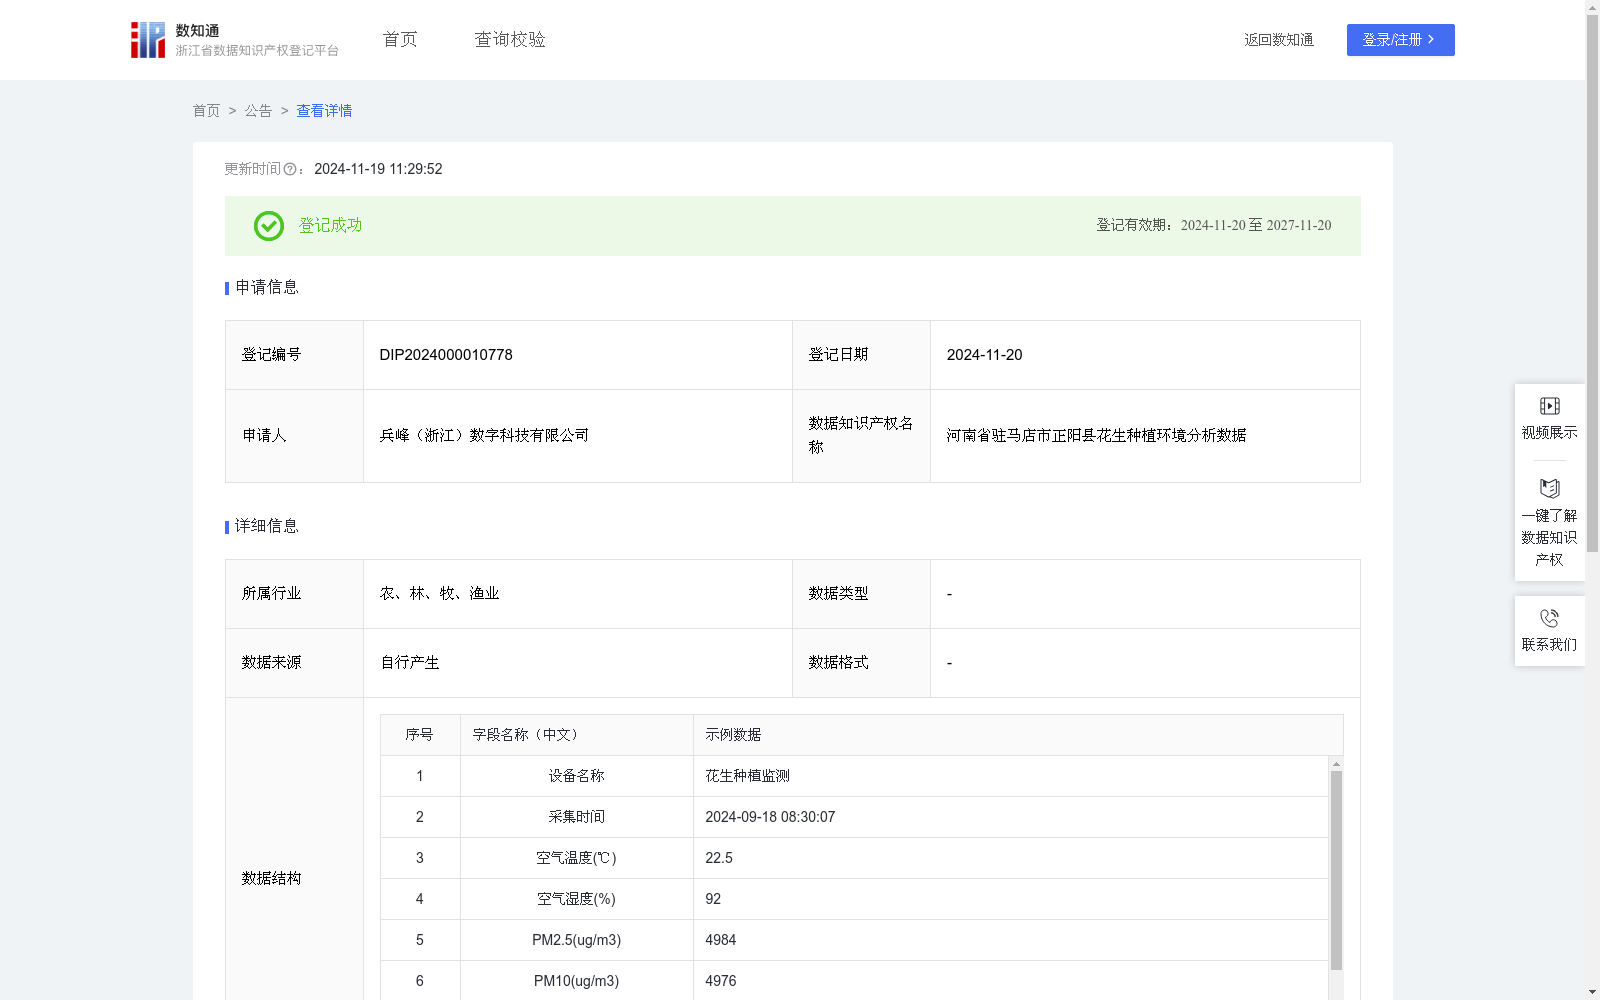
河南省驻马店市正阳县花生种植环境分析数据
收藏浙江省数据知识产权登记平台2024-11-19 更新2024-11-20 收录
下载链接:
https://www.zjip.org.cn/home/announce/trends/86195
下载链接
链接失效反馈官方服务:
资源简介:
采集花生种植的空气温湿度、光照强度、PM10、PM2.5 等数据,全面评估不同环境条件对花生生长的具体影响。如确定适宜的空气温度和湿度组合,为花生的生长提供良好的大气环境,保障植株的正常生理活动。明确合适的光照强度和时长,促使花生进行高效的光合作用,积累充足的养分以促进果实发育。同时,监测空气中的 PM10 和 PM2.5 含量,确保空气质量在可接受范围内,减少对花生生长的不良影响。利用这些数据构建花生品质与环境参数关联的深度网络模型,深入探索何种环境条件组合可以使花生具有更高的油脂含量、更优的果实饱满度和更好的口感等,为显著提升花生品质奠定基础。基于数据驱动的方式,为花生种植环境的智能调控提供有效的支持,依据实时数据自动调整通风强度、遮阳程度以及采取适当的空气净化措施等,为花生创造适宜的生长环境,提高种植效率和产量。将优化后的环境调控经验推广应用至不同地区的花生种植中,形成多维度细粒度的感知与控制模式,有力推动花生种植产业朝着科学、高效、模式可移植的方向发展,全面提升整个产业的竞争力。1.数据采集:本系统通过空气湿温度传感器、光照传感器、PM传感器等物联网设备,结合4G/5G、Wi-Fi与有线网络,实时采集种植环境中的空气湿温度、光照、PM10、PM2.5等多维数据。2.算法规则:系统采用环境参数评分算法,对环境数据进行评分。基于作物生长理想条件(如温度、湿度、PM值等),并通过以下公式计算:环境参数评分=100-Σ(w_i×|当前值_i-理想值_i|/容差_i),其中,Σ表示对所有参数的累加,w_i是第i个参数的权重。当前值_i是第i个参数的实际测量值,理想值_i是第i个参数的理想值。容差_i是第i个参数的允许波动范围。权重、理想值和容差范围设定基于历史数据分析以及实际种植经验的确定。对作物生长影响较大的参数获得较高的权重。容差范围则考虑到环境因素的波动性,针对作物对不同环境变化的耐受性设定进行适当设定,环境参数偏离理想值越多,扣分越大,以PM10为例,其权重为0.5,理想值设定为50μg/m3,容差范围为±100μg/m3,扣分计算如下:PM10扣分=0.5×|4976-50|/100=0.5×49.26=24.6。根据这些评分生成具体的环境优化方案。
This dataset collects data such as air temperature and humidity, light intensity, PM10, and PM2.5 in peanut planting to comprehensively evaluate the specific impacts of various environmental conditions on peanut growth. For example, identifying suitable combinations of air temperature and humidity to provide a favorable atmospheric environment for peanut growth and ensure the normal physiological activities of peanut plants. Clarifying appropriate light intensity and photoperiod to facilitate efficient photosynthesis in peanuts, allowing them to accumulate sufficient nutrients for fruit development. Meanwhile, monitoring the concentrations of PM10 and PM2.5 in the air to ensure air quality within acceptable limits and reduce adverse impacts on peanut growth. Using these data, a deep neural network model correlating peanut quality and environmental parameters is constructed to deeply explore which environmental condition combinations can endow peanuts with higher oil content, better fruit plumpness, and superior taste, laying a foundation for significantly improving peanut quality. Through a data-driven approach, effective support is provided for the intelligent regulation of peanut planting environments: automatically adjusting ventilation intensity, shading degree, and appropriate air purification measures based on real-time data to create a suitable growth environment for peanuts, thereby improving planting efficiency and yield. Promoting the optimized environmental regulation experience to peanut planting in different regions, forming a multi-dimensional and fine-grained perception and control model, which effectively promotes the development of the peanut planting industry towards scientific, efficient, and transplantable modes, and comprehensively enhances the competitiveness of the entire industry.
1. Data Collection: This system collects multi-dimensional data including air temperature and humidity, light intensity, PM10, and PM2.5 in the planting environment in real time via IoT devices such as air temperature and humidity sensors, light sensors, and PM sensors, combined with 4G/5G, Wi-Fi, and wired networks.
2. Algorithm Rules: The system adopts an environmental parameter scoring algorithm to score environmental data. The scoring is calculated based on the ideal conditions for crop growth (such as temperature, humidity, PM concentrations, etc.) using the following formula:
Environmental Parameter Score = 100 - Σ(w_i × |Current Value_i - Ideal Value_i| / Tolerance Range_i)
Where Σ represents the summation over all parameters, w_i is the weight of the i-th parameter, Current Value_i is the actual measured value of the i-th parameter, Ideal Value_i is the ideal value of the i-th parameter, and Tolerance Range_i is the allowable fluctuation range of the i-th parameter. The weights, ideal values, and tolerance ranges are determined based on historical data analysis and actual planting experience. Parameters with greater impacts on crop growth are assigned higher weights. The tolerance ranges are appropriately set considering the volatility of environmental factors and the crop's tolerance to different environmental changes. The greater the deviation of an environmental parameter from its ideal value, the more points are deducted. Taking PM10 as an example, its weight is 0.5, the ideal value is set to 50 μg/m³, and the tolerance range is ±100 μg/m³. The deduction calculation is as follows:
PM10 Deduction = 0.5 × |4976 - 50| / 100 = 0.5 × 49.26 = 24.6
Specific environmental optimization schemes are generated based on these scores.
提供机构:
兵峰(浙江)数字科技有限公司
创建时间:
2024-10-08
搜集汇总
数据集介绍
特点
河南省驻马店市正阳县花生种植环境分析数据包含801条记录,每日更新,涵盖空气温湿度、光照、PM等环境参数,用于评估和优化花生生长条件,支持智能调控模型构建。
以上内容由遇见数据集搜集并总结生成


