
Los Angeles Ozone's dataset
收藏BigML2026-05-10 更新2025-01-04 收录
下载链接:
https://bigml.com/user/jarcosr/gallery/dataset/649be77368671c2ea8cad904
下载链接
链接失效反馈官方服务:
资源简介:
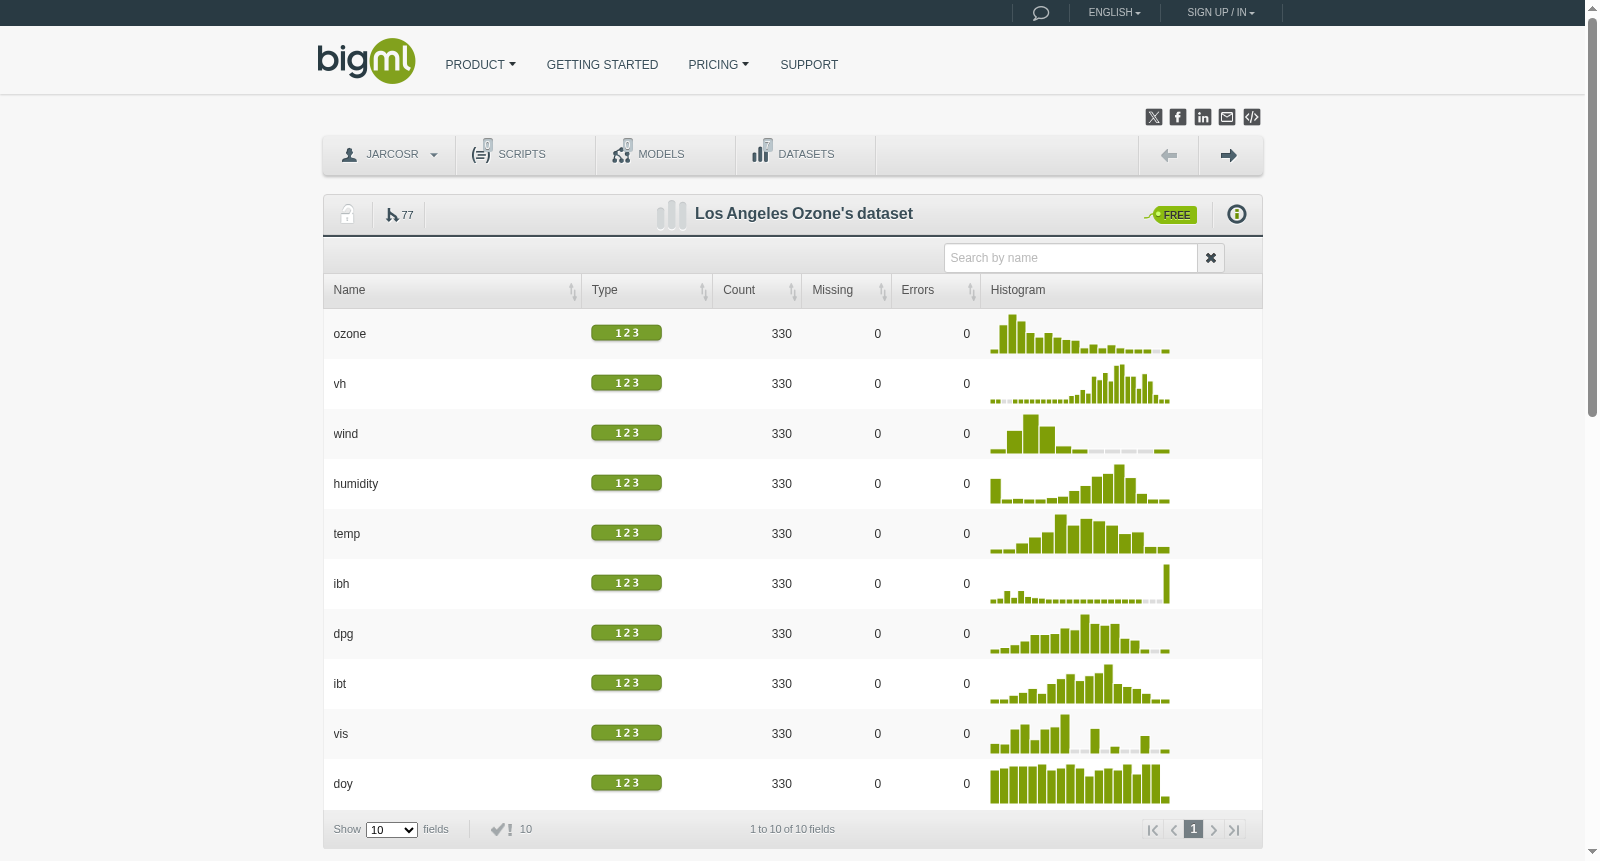
These data record the level of atmospheric ozone concentration from eight daily meteorological measurements made in the Los Angeles basin in 1976. Although measurements were made every day that year, some observations were missing; here we have the 330 complete cases. The response, referred to as ozone, is actually the log of the daily maximum of the hourly-average ozone concentrations in Upland, California.
Detailed variable names:
****ozone** : **
Upland Maximum Ozone
- **vh** : Vandenberg 500 mb Height
- **wind** : Wind Speed (mph)
- **humidity** : Humidity (%)
- **temp** : Sandburg AFB Temperature
- **ibh** : Inversion Base Height
- **dpg** : Daggot Pressure Gradient
- **ibt** : Inversion Base Temperature
- **vis** : Visibility (miles)
- **doy** : Day of the Year
Source: http://www-stat.stanford.edu/~tibs/ElemStatLearn/data.html
创建时间:
2023-06-28
原始信息汇总
数据集概述
基本信息
- 数据集名称: Los Angeles Ozones dataset
- 数据集大小: 11.2 KB
- 字段数量: 10
- 实例数量: 330
- 数据集URL: https://bigml.com/user/jarcosr/gallery/dataset/649be77368671c2ea8cad904
- 许可证: 免费 (FREE)
描述
该数据集记录了1976年洛杉矶盆地每日八次气象测量的大气臭氧浓度水平。虽然当年每天都有测量,但部分观测数据缺失;此处提供了330个完整案例。响应变量称为“ozone”,实际上是加利福尼亚州Upland地区每小时平均臭氧浓度日最大值的对数。
变量详情
- ozone: Upland最大臭氧浓度
- vh: Vandenberg 500 mb高度
- wind: 风速 (mph)
- humidity: 湿度 (%)
- temp: Sandburg AFB温度
- ibh: 逆温层基础高度
- dpg: Daggot压力梯度
- ibt: 逆温层基础温度
- vis: 能见度 (英里)
- doy: 一年中的第几天
数据来源
标签
- Los Angeles
- Ozone
搜集汇总
数据集介绍
背景与挑战
背景概述
该数据集包含1976年洛杉矶盆地330天的完整气象观测记录,主要测量臭氧浓度对数(基于Upland地区每小时均值)及8项关联气象指标,如风速、湿度、温度等。数据源自斯坦福大学统计实验室公开资源。
以上内容由遇见数据集搜集并总结生成



