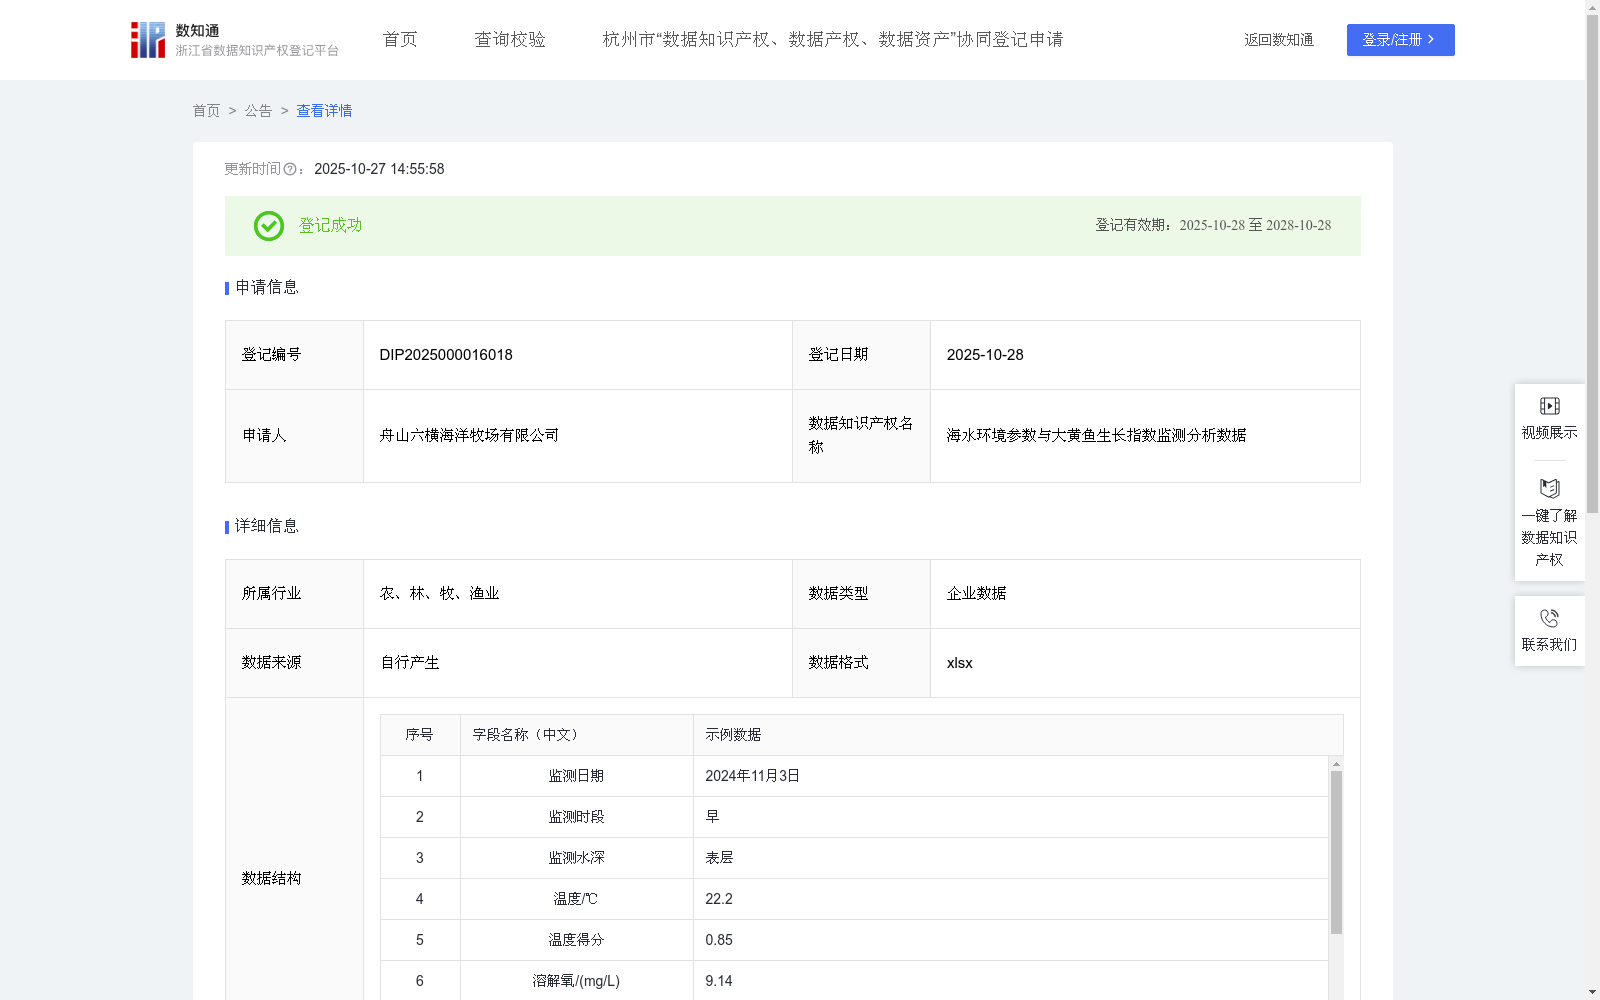
海水环境参数与大黄鱼生长指数监测分析数据
收藏浙江省数据知识产权登记平台2025-10-27 更新2025-10-28 收录
下载链接:
https://www.zjip.org.cn/home/announce/trends/6015396
下载链接
链接失效反馈官方服务:
资源简介:
一、适用条件与范围
适用对象:
生产端:大黄鱼网箱/围栏养殖企业、陆基工厂化循环水养殖场
监管端:地方水产技术推广站、渔业环境监测中心
服务端:水产物联网设备商、渔业保险机构
地理范围:近岸养殖区、半开放海湾、深水抗风浪网箱海域
适用鱼种:大黄鱼(核心),可扩展至鲷科、鲳科等近暖水性海水鱼
二、解决的核心问题
(1)动态风险防控
通过生长指数对环境状态进行分级(优越/良好/一般/危险/极度危险),自动识别环境异常(如高温缺氧),及时触发增氧、调水等干预措施,降低鱼群死亡率。
(2)资源精准调配
基于海水参数、生长指数和环境状态分级自动调节投饵机、增氧机启停,避免浪费,节约能耗。
(3)养殖规划支撑
企业可对比不同海域长期生长指数,划定适宜养殖区/禁养区。
三、外部复用价值
保险机构:依据生长指数历史数据精算养殖灾害风险,定制保险产品。
供应链企业:根据生长指数预判产量波动,优化活鱼采购及冷链调度计划。
四、有益效果
降低养殖损失:提升异常环境响应速度;
增产增效:精准投喂降低饲料成本;
行业标准化:为绿色养殖认证提供量化依据。1. 数据采集
实时监测海水参数:水温(单位:℃)、盐度(单位:‰)、溶解氧(单位:mg/L)
2. 数据处理
对采集的海水参数按规则计算单项得分(满分均为1.0分):
(1)温度得分规则
海水的温度(T)得分(S_t)根据以下区间和公式计算:
当T≤12℃或T> 32℃时,得分S_t = 0
当12℃< T≤18℃时,得分S_t = (T-12) / 12
当18℃< T≤24℃时,得分S_t = 0.5 + (T-18) / 12
当24℃< T≤26℃时,得分S_t = 1.0
当26℃< T≤30℃时,得分S_t = 1- (T-26) / 8
当30℃< T≤32℃时,得分S_t = (32-T) / 4。
(2)盐度得分规则
海水的盐度(S)得分(S_s)根据以下区间和公式计算:
当S≤5‰或S> 40‰时,得分S_s = 0
当5‰<S≤15‰时,得分S_s = (S-5) / 33
当15‰<S≤25‰时,得分S_s = 0.3 + (S-15) / 33
当25‰<S≤30‰时,得分S_s = 1.0
当30‰<S≤40‰时,得分S_s = 1- (S-30) / 20
(3)溶解氧得分规则
海水的溶解氧(DO)得分(S_do)根据以下区间和公式计算:
当DO≤2.0 mg/L时,得分S_do = 0
当2.0 mg/L<DO≤3.0 mg/L时,得分S_do= DO-2
当3.0 mg/L<DO< 6.0 mg/L时,得分S_do= 0.2+ (DO-3)×0.27
当DO≥6.0 mg/L时,得分S_do=1.0
3. 核心算法规则
生长指数 = (温度得分×盐度得分×溶解氧得分) × 100%
环境状态判定规则:
生长指数≥80%,环境状态为优越;
60%≤生长指数<80%,环境状态为良好;
40%≤生长指数<60%,环境状态为一般;
20%≤生长指数<39%,环境状态为危险;
生长指数<20%,环境状态为极度危险。
1. Application Conditions and Scope
Applicable Objects:
Production side: Large yellow croaker cage/pen aquaculture enterprises, land-based recirculating aquaculture system (RAS) farms
Regulatory side: Local aquatic technology extension stations, fishery environmental monitoring centers
Service side: Aquatic Internet of Things (IoT) equipment suppliers, fishery insurance institutions
Geographical scope: Nearshore aquaculture areas, semi-enclosed bays, deep-water wave-resistant cage aquaculture zones
Target fish species: Large yellow croaker (core), expandable to Sparidae, Stromateidae and other warm-temperate marine fish
2. Core Problems Solved
(1) Dynamic Risk Prevention and Control
Classify environmental status via growth index (excellent/good/fair/dangerous/extremely dangerous), automatically identify environmental anomalies (e.g., high temperature and hypoxia), trigger interventions such as aeration and water regulation in a timely manner to reduce fish mortality.
(2) Precise Resource Allocation
Automatically adjust the start/stop of feeders and aerators based on seawater parameters, growth index and environmental status classification to avoid waste and save energy consumption.
(3) Aquaculture Planning Support
Enterprises can compare long-term growth index data of different sea areas to delimit suitable aquaculture zones and prohibited aquaculture zones.
3. External Reusability Value
Insurance institutions: Use historical growth index data to accurately calculate aquaculture disaster risks and customize insurance products.
Supply chain enterprises: Predict production fluctuations based on growth index, optimize live fish procurement and cold chain scheduling plans.
4. Beneficial Effects
Reduce aquaculture losses: Improve response speed to abnormal environments;
Increase production and efficiency: Precise feeding reduces feed costs;
Industry standardization: Provide quantitative basis for green aquaculture certification.
1. Data Collection
Real-time monitoring of seawater parameters: water temperature (unit: ℃), salinity (unit: ‰), dissolved oxygen (unit: mg/L)
2. Data Processing
Calculate individual scores (full score is 1.0) for collected seawater parameters according to specified rules:
(1) Temperature Score Rule
The temperature score (S_t) of seawater (T) is calculated using the following intervals and formulas:
When T ≤ 12℃ or T > 32℃, S_t = 0
When 12℃ < T ≤ 18℃, S_t = (T - 12) / 12
When 18℃ < T ≤ 24℃, S_t = 0.5 + (T - 18) / 12
When 24℃ < T ≤ 26℃, S_t = 1.0
When 26℃ < T ≤ 30℃, S_t = 1 - (T - 26) / 8
When 30℃ < T ≤ 32℃, S_t = (32 - T) / 4
(2) Salinity Score Rule
The salinity score (S_s) of seawater (S) is calculated using the following intervals and formulas:
When S ≤ 5‰ or S > 40‰, S_s = 0
When 5‰ < S ≤ 15‰, S_s = (S - 5) / 33
When 15‰ < S ≤ 25‰, S_s = 0.3 + (S - 15) / 33
When 25‰ < S ≤ 30‰, S_s = 1.0
When 30‰ < S ≤ 40‰, S_s = 1 - (S - 30) / 20
(3) Dissolved Oxygen Score Rule
The dissolved oxygen (DO) score (S_do) of seawater is calculated using the following intervals and formulas:
When DO ≤ 2.0 mg/L, S_do = 0
When 2.0 mg/L < DO ≤ 3.0 mg/L, S_do = DO - 2
When 3.0 mg/L < DO < 6.0 mg/L, S_do = 0.2 + (DO - 3) × 0.27
When DO ≥ 6.0 mg/L, S_do = 1.0
3. Core Algorithm Rules
Growth Index = (Temperature Score × Salinity Score × Dissolved Oxygen Score) × 100%
Environmental Status Judgment Rules:
Growth Index ≥ 80%: Environmental status is excellent;
60% ≤ Growth Index < 80%: Environmental status is good;
40% ≤ Growth Index < 60%: Environmental status is fair;
20% ≤ Growth Index < 39%: Environmental status is dangerous;
Growth Index < 20%: Environmental status is extremely dangerous.
提供机构:
舟山六横海洋牧场有限公司
创建时间:
2025-08-18
搜集汇总
数据集介绍
背景与挑战
背景概述
该数据集记录了海水环境参数(如温度、溶解氧、盐度)与大黄鱼生长指数的监测数据,包含597条记录,每日更新。通过算法计算生长指数并分级环境状态,支持大黄鱼养殖的动态风险防控和资源精准调配,适用于养殖企业、监管机构和服务端优化决策。
以上内容由遇见数据集搜集并总结生成


