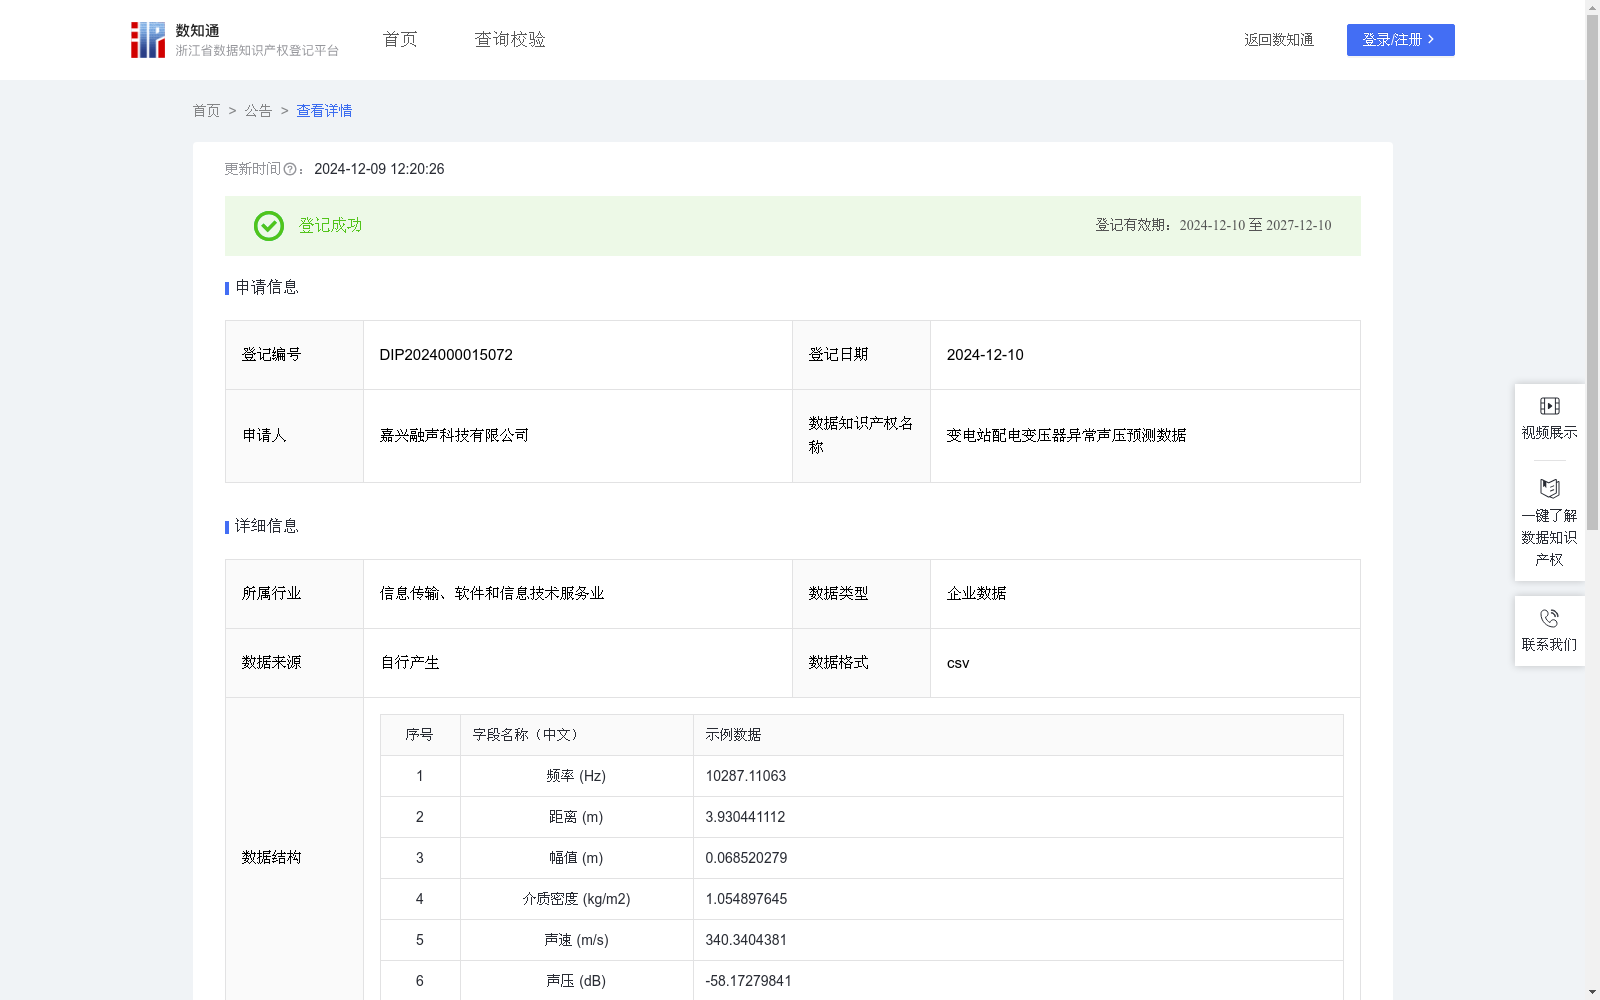
变电站配电变压器异常声压预测数据
收藏浙江省数据知识产权登记平台2024-12-09 更新2024-12-10 收录
下载链接:
https://www.zjip.org.cn/home/announce/trends/98346
下载链接
链接失效反馈官方服务:
资源简介:
根据搜集到的频率、距离、幅值、介质密度、声速等基础信息,计算出变电站配电变压器声压值,根据配电变压器的声压阈值区间,判断出配电变压器的声压是否存在异常,从而为企业作业的安全提供了保障。1.数据搜集:搜集到配电变压器的声学振动信号数据,并将其作为特征变量。同时,收集对应的声压数据,作为目标变量。2.预处理:利用归一化公式x=(xi-min)/(max-min);其中xi是样本字段中第i条数据,x是归一化后的值;3.模型训练:用Python语言环境运行,方法为XGBoost算法,预测变电站变压器的声压。XGBoost的目标函数由两部分组成:损失函数和正则化项。损失函数用于衡量模型预测值与实际值之间的差异,而正则化项则用于控制模型的复杂度,防止过拟合。公式如下:F(x)=求和L(yi,y^i)+求和(m(f(k))),其中L(yi,y^i)表示第i个样本的损失函数,yi是实际值,y^i是预测值;m(f(k))表示第 k 棵树的复杂度。当损失函数F(x)最小化时则停止迭代过程,在此过程中y^i预测值是通过特征函数进行求解的,具体计算方式如下:通过对于目标函数的求导,紧接着并令导数等于0,从而解出叶子节点的最优分数。通过不断地选择最优分裂点并构建树结构,XGBoost最终可以得到一棵最优的树模型。然后,将多棵树模型的预测结果进行累加,即可得到最终的预测值。4.模型迭代和更新,利用交叉验证来评估模型的稳定性和性能,其中交叉验证公式如下:m=求和(yi-y^i)/N;其中m代表交叉验证误差、N代表数据样本的数量、yi代表第 i 个样本的实际观测值、y^i代表第 i 个样本的模型预测值。若满足交叉验证的误差范围则退出迭代过程,输出模型参数值。
Based on collected basic information including frequency, distance, amplitude, medium density, sound velocity and other relevant parameters, the sound pressure value of distribution transformers in substations is calculated. Then, by comparing with the sound pressure threshold range of distribution transformers, we can determine whether the sound pressure of the transformer is abnormal, thereby ensuring the safety of enterprise operations.
1. Data Collection: Collect acoustic vibration signal data of distribution transformers as feature variables, and collect corresponding sound pressure data as target variables.
2. Preprocessing: Use the normalization formula $x = frac{x_i - ext{min}}{max - min}$, where $x_i$ is the i-th data point in the sample field, and $x$ is the normalized value.
3. Model Training: Implemented in the Python environment, the XGBoost algorithm is adopted to predict the sound pressure of transformers in substations. The objective function of XGBoost consists of two parts: the loss function and the regularization term. The loss function measures the difference between the model's predicted values and the actual values, while the regularization term controls the complexity of the model to prevent overfitting. The formula is as follows:
$$F(x) = sum_{i=1}^N L(y_i, hat{y}_i) + sum_{k=1}^K m(f_k)$$
where $L(y_i, hat{y}_i)$ denotes the loss function of the i-th sample, $y_i$ is the actual observed value, and $hat{y}_i$ is the predicted value; $m(f_k)$ represents the complexity of the k-th decision tree. The iteration process stops when the objective function $F(x)$ is minimized. During this process, the predicted value $hat{y}_i$ is solved via the feature function, with the specific calculation steps as follows: First, take the derivative of the objective function, then set the derivative to zero to obtain the optimal score of the leaf nodes. By continuously selecting optimal split points and constructing tree structures, XGBoost finally obtains an optimal decision tree model. The final predicted value is obtained by summing the prediction results of all decision tree models.
4. Model Iteration and Update: Cross-validation is used to evaluate the stability and performance of the model. The formula for cross-validation is as follows:
$$m = frac{sum_{i=1}^N (y_i - hat{y}_i)}{N}$$
where $m$ represents the cross-validation error, $N$ represents the number of data samples, $y_i$ represents the actual observed value of the i-th sample, and $hat{y}_i$ represents the model's predicted value of the i-th sample. The iteration stops and the model parameters are output when the cross-validation error falls within the predefined range.
提供机构:
嘉兴融声科技有限公司
创建时间:
2024-11-08
搜集汇总
数据集介绍
以上内容由遇见数据集搜集并总结生成


