Maps of vegetation dynamics in Berlin between 1988 and 2017
收藏Mendeley Data2024-03-27 更新2024-06-27 收录
下载链接:
https://figshare.com/articles/dataset/Maps_of_vegetation_dynamics_in_Berlin_between_1988_and_2017/23669142/1
下载链接
链接失效反馈官方服务:
资源简介:
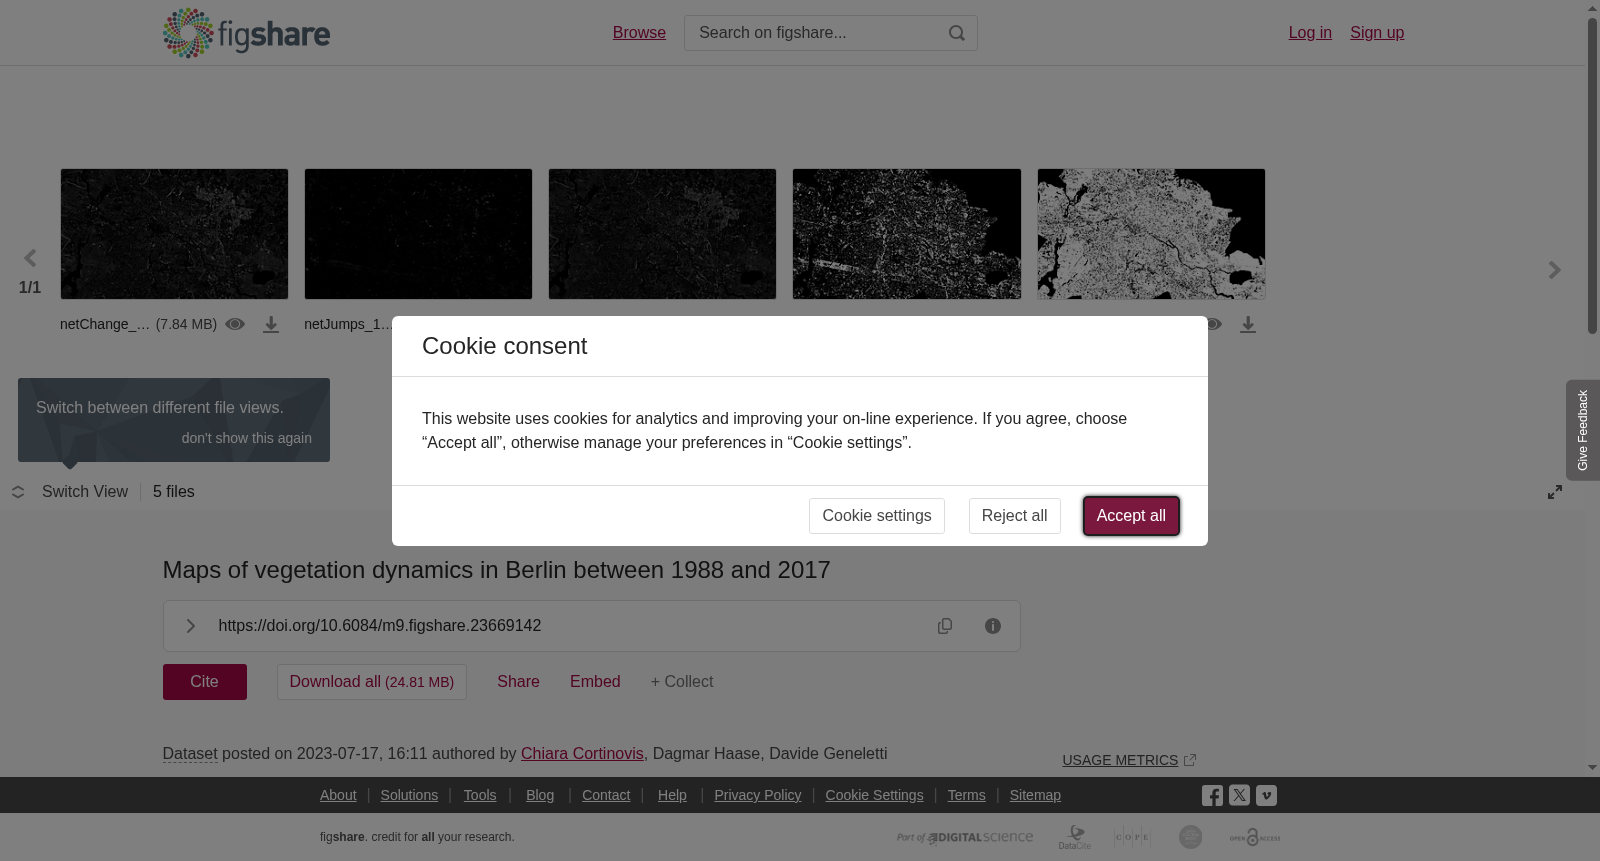
Results of the analysis described in the article: Cortinovis C., Haase D., Geneletti D. (2023). Gradual or abrupt? An algorithm to monitor urban vegetation dynamics in support of greening policies. Urban Forestry & Urban Greening. https://doi.org/10.1016/j.ufug.2023.128030 The article applied an algorithm to characterize vegetation dynamics in the city of Berlin in three decades between 1988 and 2017. The algorithm distinguishes the contribution of gradual and abrupt changes to the total change observed during the analysed period. The results are presented as raster maps in .tif format with a resolution of 30 m, EPSG:3035. Areas outside the city administrative boundaries and water areas are masked (nodata). netChange_1988-2017_masked.tif is the map of the total net NDVI change (calculated on the annual greenest pixel composite) during the whole period. netJumps_1988-2017_masked.tif is the map of the net NDVI change due to abrupt changes during the whole period. netSlopes_1988-2017_masked.tif is the map of the net NDVI change due to gradual changes during the whole period. jumpsCountRast_1988-2017_masked.tif is the map of the number of abrupt changes observed for each pixel during the analysed period. slopesCountRast_1988-2017_masked.tif is the map of the number of years during the analysed period in which each pixel showed a gradual change. To replicate the analysis, use the R code of the algorithm available at https://doi.org/10.6084/m9.figshare.23668941.v1 and the input data available at https://doi.org/10.6084/m9.figshare.23668842.v1, adjusting the time frame of the analysis.
本数据集对应论文《渐进抑或突变?支撑绿化政策的城市植被动态监测算法》(Cortinovis C., Haase D., Geneletti D. 2023)的分析结果,该论文发表于《城市林业与城市绿化(Urban Forestry & Urban Greening)》,DOI链接:https://doi.org/10.1016/j.ufug.2023.128030。该研究针对1988至2017年的三十年时段内柏林城市植被动态特征构建监测算法,可量化区分渐变与突变两类变化对分析时段内总植被变化的贡献占比。本数据集以空间分辨率30米、坐标系为EPSG:3035的.TIFF格式栅格地图形式提供,已对柏林行政边界外区域与水体区域进行掩膜处理(赋值为无数据nodata)。本次发布的数据集包含以下文件:1. netChange_1988-2017_masked.tif:全时段总归一化植被指数(Normalized Difference Vegetation Index, NDVI)净变化图,该数据基于年度最绿像素合成产物计算得到;2. netJumps_1988-2017_masked.tif:全时段由突变型变化引发的NDVI净变化图;3. netSlopes_1988-2017_masked.tif:全时段由渐变型变化引发的NDVI净变化图;4. jumpsCountRast_1988-2017_masked.tif:分析时段内各像元观测到的突变次数分布图;5. slopesCountRast_1988-2017_masked.tif:分析时段内各像元呈现渐变变化的年数分布图。如需复现本分析流程,可使用公开于https://doi.org/10.6084/m9.figshare.23668941.v1的算法R代码,以及公开于https://doi.org/10.6084/m9.figshare.23668842.v1的配套输入数据,并根据需求调整分析时间范围。
创建时间:
2023-07-26
搜集汇总
数据集介绍
背景与挑战
背景概述
该数据集提供了柏林1988年至2017年间植被动态的详细栅格地图,包括总NDVI变化、突变和渐变引起的NDVI变化,以及突变和渐变的频率。这些数据支持城市绿化政策的监测和评估,分辨率为30米,覆盖柏林行政边界内的区域。
以上内容由遇见数据集搜集并总结生成


