
SAMPLE Salary Data | AI-Predicted Pay for 800M+ US Job Postings | Enriched Salary Data for ...
收藏Databricks2026-01-19 收录
下载链接:
https://marketplace.databricks.com/details/a71836df-8cb1-41ee-90bb-2f5fea060cca/Canaria-Inc-_SAMPLE-Salary-Data-AI-Predicted-Pay-for-800M+-US-Job-Postings-Enriched-Salary-Data-for-
下载链接
链接失效反馈官方服务:
资源简介:
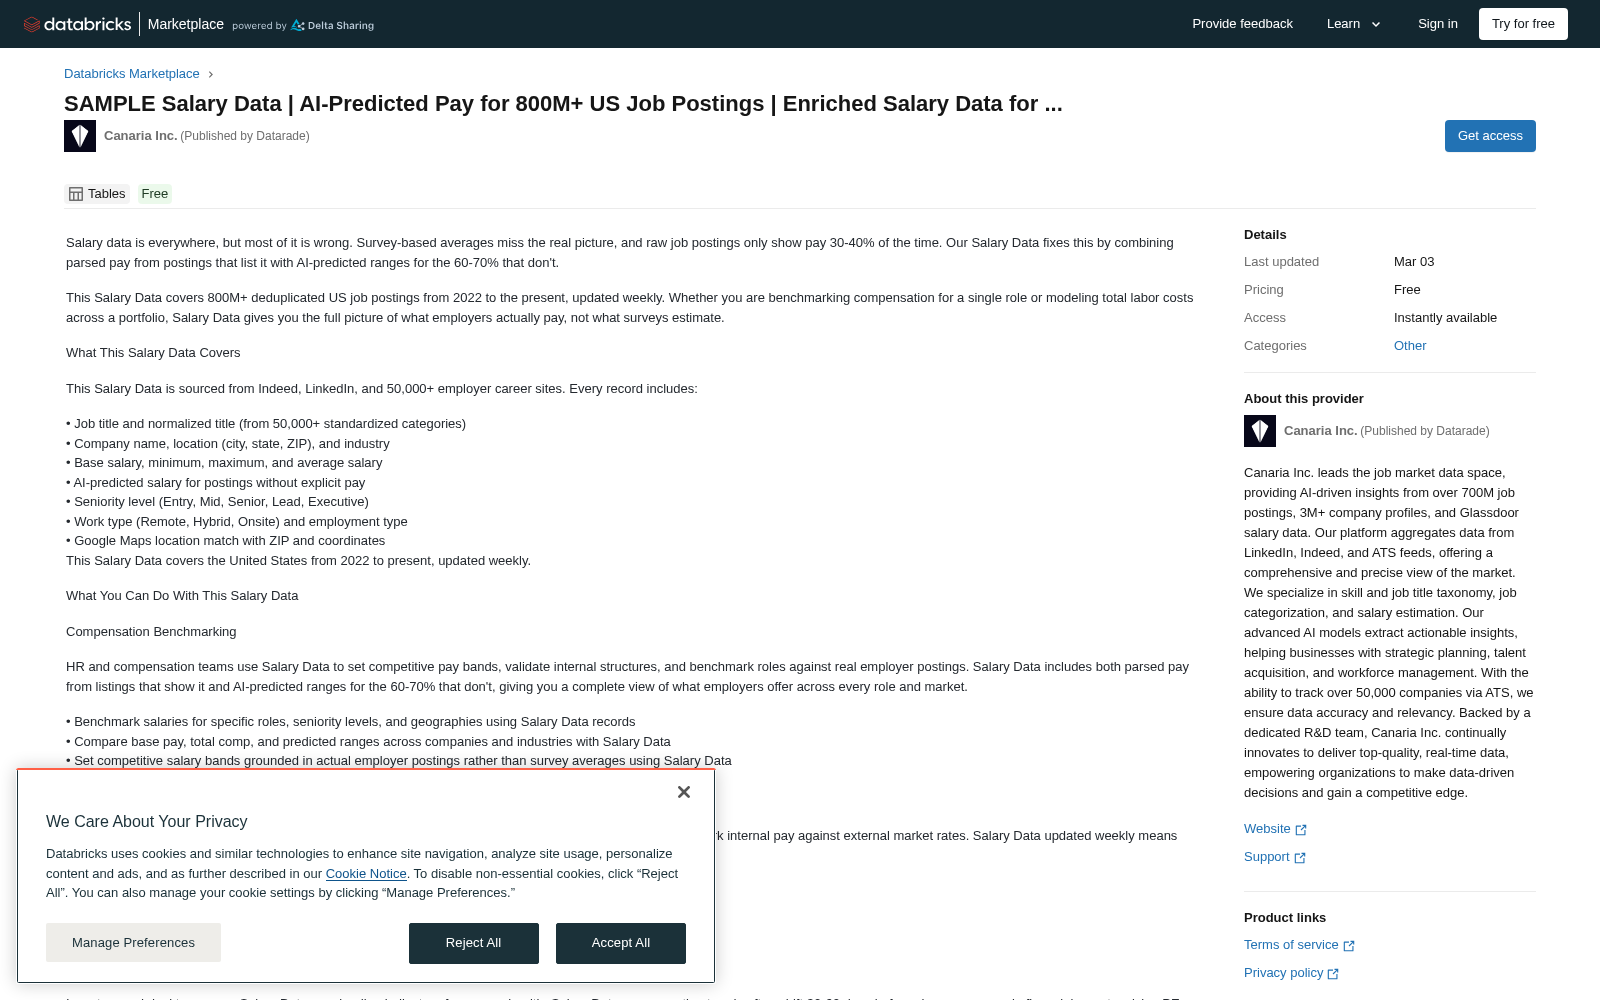
Salary data is everywhere, but most of it is wrong. Survey-based averages miss the real picture, and raw job postings only show pay 30-40% of the time. Our Salary Data fixes this by combining parsed pay from postings that list it with AI-predicted ranges for the 60-70% that don't.
This Salary Data covers 800M+ deduplicated US job postings from 2022 to the present, updated weekly. Whether you are benchmarking compensation for a single role or modeling total labor costs across a portfolio, Salary Data gives you the full picture of what employers actually pay, not what surveys estimate.
What This Salary Data Covers
This Salary Data is sourced from Indeed, LinkedIn, and 50,000+ employer career sites. Every record includes:
• Job title and normalized title (from 50,000+ standardized categories)
• Company name, location (city, state, ZIP), and industry
• Base salary, minimum, maximum, and average salary
• AI-predicted salary for postings without explicit pay
• Seniority level (Entry, Mid, Senior, Lead, Executive)
• Work type (Remote, Hybrid, Onsite) and employment type
• Google Maps location match with ZIP and coordinates
This Salary Data covers the United States from 2022 to present, updated weekly.
What You Can Do With This Salary Data
Compensation Benchmarking
HR and compensation teams use Salary Data to set competitive pay bands, validate internal structures, and benchmark roles against real employer postings. Salary Data includes both parsed pay from listings that show it and AI-predicted ranges for the 60-70% that don't, giving you a complete view of what employers offer across every role and market.
• Benchmark salaries for specific roles, seniority levels, and geographies using Salary Data records
• Compare base pay, total comp, and predicted ranges across companies and industries with Salary Data
• Set competitive salary bands grounded in actual employer postings rather than survey averages using Salary Data
• Validate pay equity across roles and seniority levels using Salary Data parsed and predicted pay fields
HR Analytics
People analytics teams use Salary Data to track compensation trends, power internal dashboards, and benchmark internal pay against external market rates. Salary Data updated weekly means your dashboards reflect what companies are posting today, not last quarter.
• Track compensation trends over time across roles, industries, and geographies using Salary Data
• Power People Analytics dashboards with Salary Data parsed and AI-predicted pay fields
• Benchmark internal pay against external Salary Data records by role, region, and seniority
• Analyze competitor compensation strategies using Salary Data job posting and pay records
Financial Intelligence and Investment Analysis
Investors and deal teams use Salary Data as a leading indicator of company health. Salary Data compensation trends often shift 30-60 days before changes appear in financial reports, giving PE, VC, and hedge fund teams early signals on acquisition targets and portfolio companies.
• Monitor portfolio company hiring velocity and compensation levels using Salary Data signals
• Use Salary Data hiring and pay trends as alternative data for investment thesis validation
• Estimate labor cost exposure for target companies using Salary Data by role, seniority, and location
• Assess sector-wide wage inflation trends through Salary Data historical records
• Track early warning signals through sudden shifts in Salary Data pay ranges or posting velocity
Workforce Planning and Site Selection
Site selection consultants and economic development teams use Salary Data to quantify labor cost differences across geographies and prove competitive compensation environments for RFIs. Salary Data with ZIP-level granularity gives workforce planners the inputs needed to model total labor costs for any proposed location.
• Map labor cost differentials by geography using Salary Data pay records at ZIP and city level
• Prove competitive compensation environments for site selection RFIs with Salary Data
• Forecast headcount spend for geographic expansion using Salary Data by role and location
• Build workforce cost benchmarks using Salary Data parsed and predicted pay fields
Payroll Forecasting and FP&A
Finance and FP&A teams use Salary Data to model compensation costs, forecast headcount spend, and build budget scenarios grounded in real market data. Salary Data by role, seniority, and location gives finance teams the inputs needed to move beyond internal assumptions.
• Model payroll costs by role, seniority, and geography using Salary Data pay benchmarks
• Forecast headcount spend scenarios using Salary Data as a real-world compensation input
• Validate internal compensation assumptions against external Salary Data records
• Analyze compensation-to-revenue ratios across sectors using Salary Data historical records
How We Build This Salary Data
The salary estimation model is the core engine behind this Salary Data. About 60-70% of job postings do not include explicit pay. The model predicts salary ranges for those records using company-level compensation history, geographic cost-of-living adjustments, role seniority, and industry norms. Trained on 50M+ observations, it achieves a Mean Absolute Percentage Error under 15%, making this Salary Data a reliable foundation for compensation benchmarking and financial modeling.
The title taxonomy model normalizes every Salary Data job title into 50,000+ standardized categories from 20M+ raw titles, enabling consistent comparison across companies, industries, and geographies.
Job category models classify each Salary Data record by seniority (Entry, Mid, Senior, Lead, Executive) and work modality (Remote, Hybrid, Onsite) using LLM-based analysis of the full job description.
Our annotation team validates every Salary Data model output before delivery.
What Makes This Salary Data Different
• Full pay coverage: Salary Data combines parsed pay from postings that list it with AI-predicted ranges for the 60-70% that don't
• 800M+ records: Salary Data collapses billions of raw postings into deduplicated records that reflect true hiring intent
• Prediction accuracy: Salary Data salary predictions achieve a MAPE under 15% trained on 50M+ observations
• Matchable: Salary Data joins directly with job postings, company profiles, and Google Maps location data
• Normalized titles: Salary Data job titles are standardized to 50,000+ categories for cross-company comparison
• Weekly updates: Salary Data refreshes weekly so compensation benchmarks reflect current employer activity
Who Uses This Salary Data
• HR and Compensation Teams use Salary Data to benchmark salaries, set competitive pay bands, and validate internal pay structures
• People Analytics Teams use Salary Data to track compensation trends and power internal pay equity dashboards
• Finance and FP&A Teams use Salary Data to model payroll costs, forecast headcount spend, and build budget scenarios
• Investors, PE Firms, and VC Funds use Salary Data as alternative data for due diligence, portfolio monitoring, and investment thesis validation
• Compensation Consultants use Salary Data to advise clients on market rates, competitive pay positioning, and role benchmarking
• Site Selection Consultants and EDOs use Salary Data to quantify labor cost differentials and build workforce cost reports for RFIs
• HR Tech Companies and B2B Platforms use Salary Data to power compensation benchmarking tools, salary estimators, and employer intelligence products
Delivery and Format
Salary Data is delivered in CSV, JSON, or Parquet via AWS S3 or Google Cloud Storage. Custom filters by geography (ZIP, city, state), company, date range, title, industry, seniority, and salary range. Compatible with Snowflake, Databricks, Power BI, Tableau, Salesforce, and most BI platforms.
提供机构:
Canaria Inc.
搜集汇总
数据集介绍
背景与挑战
背景概述
该数据集整合了2022年至今800M+条美国职位发布的薪资信息,通过AI预测填补60-70%未明确列出薪资的职位数据,提供包括职位、公司、地理位置、薪资范围等详细信息,每周更新,适用于人力资源、财务分析及投资决策等多个领域。
以上内容由遇见数据集搜集并总结生成



