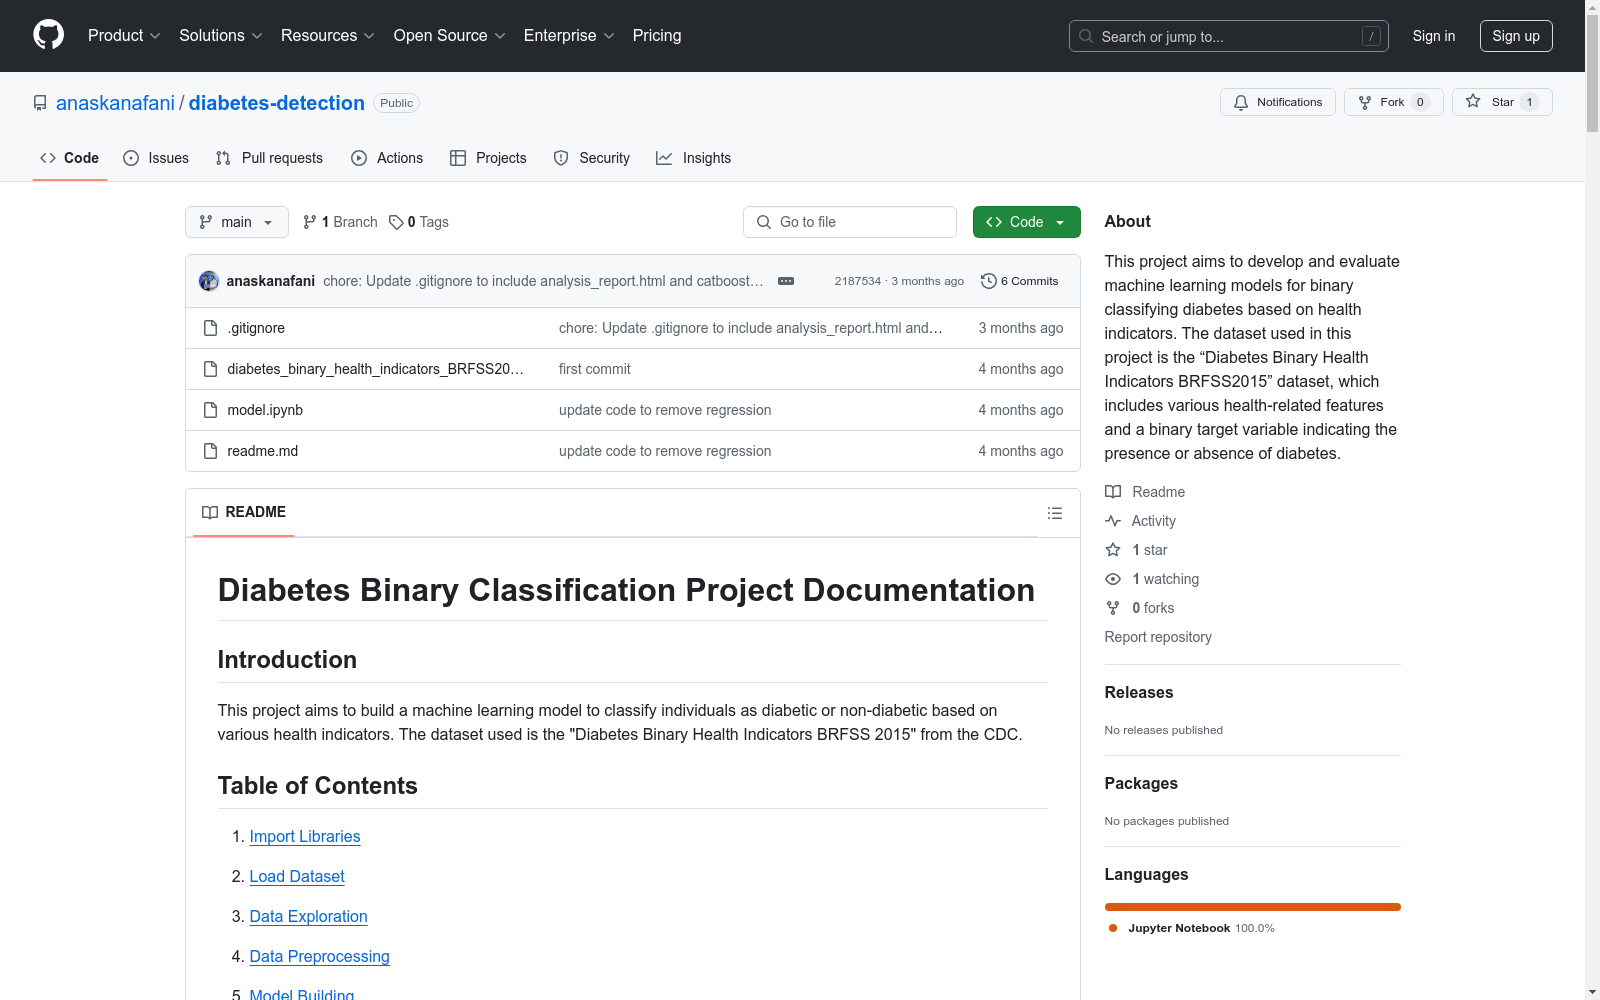
Diabetes Binary Health Indicators BRFSS2015
收藏糖尿病二元分类项目文档
简介
本项目旨在基于多种健康指标构建机器学习模型,对个体进行糖尿病与否的分类。使用的数据集是“Diabetes Binary Health Indicators BRFSS 2015”,来自美国疾病控制与预防中心(CDC)。
数据集加载
数据集通过以下代码加载: python df = pd.read_csv("diabetes_binary_health_indicators_BRFSS2015.csv")
数据探索
概况报告
生成的概况报告提供了数据集的全面概览,包括分布、缺失值、相关性等: python profile = ProfileReport(df, title="Profiling Report") profile.to_file("analysis_report.html")
基本探索
基本探索包括数据集的前几行、列信息、统计摘要、信息概览、缺失值、重复行和唯一值数量以及相关性矩阵: python print("First few rows of the dataset:") df.head()
print("Columns in the dataset:") df.columns
print("Statistical summary of the dataset:") df.describe().T
print("Information about the dataset:") df.info()
print("Number of missing values in each column:") df.isnull().sum()
print("Number of duplicated rows in the dataset:") df.duplicated().sum()
print("Number of unique values in each column:") df.nunique()
print("Correlation matrix:") df.corr(numeric_only=True)
可视化探索
可视化探索包括相关性热图、糖尿病二元分类的类分布图以及与糖尿病二元分类的相关性图: python plt.figure(figsize=(16,10)) sns.heatmap(df.corr(), annot=True) plt.show()
sns.countplot(x=Diabetes_binary, data=df) plt.title("Class Distribution of Diabetes_binary") plt.show()
plt.figure(figsize=(12, 8)) df.corr()[Diabetes_binary].sort_values().plot(kind=bar) plt.title(Correlation with Diabetes_binary) plt.show()
数据预处理
处理缺失值和重复行
数据集不含缺失值,但有重复行需要处理。
数据分割
数据集被分割为训练集和测试集: python X = df.drop(columns=Diabetes_binary) y = df[Diabetes_binary] X_train, X_test, y_train, y_test = train_test_split(X, y, test_size=0.2, random_state=42)
数据缩放
使用多种缩放器处理数据:
- StandardScaler
- MinMaxScaler
- RobustScaler
处理不平衡数据
使用SMOTE处理不平衡数据: python smote = SMOTE(random_state=42) X_train_res, y_train_res = smote.fit_resample(X_train, y_train)
模型构建
构建了多种分类模型,包括:
- Logistic Regression
- RandomForestClassifier
- GradientBoostingClassifier
- KNeighborsClassifier
- GaussianNB
- DecisionTreeClassifier
- XGBClassifier
- CatBoostClassifier
示例管道与逻辑回归
python pipeline = Pipeline([ (scaler, StandardScaler()), (classifier, RandomForestClassifier()) ])
param_grid = { classifier__C: [0.1, 1, 10], classifier__penalty: [l2] }
grid_search = GridSearchCV(pipeline, param_grid, cv=5) grid_search.fit(X_train_res, y_train_res)
模型评估
模型评估使用以下指标:
- 准确率
- 精确度
- 召回率
- F1分数
示例评估代码
python from sklearn.metrics import classification_report, confusion_matrix y_pred = grid_search.predict(X_test) print(classification_report(y_test, y_pred)) print(confusion_matrix(y_test, y_pred))
发现与学习
- 数据质量: 数据集包含大量重复行,需要移除。
- 特征重要性: 某些特征如BMI、HighBP和Age与糖尿病有较高相关性。
- 类别不平衡: 目标变量不平衡,需要使用SMOTE等技术处理。
- 模型性能: 集成模型如随机森林和梯度提升表现优于简单模型如逻辑回归和朴素贝叶斯。
- 超参数调优: GridSearchCV有效调优超参数,提升模型性能。
结论
本项目成功使用多种机器学习模型对个体进行糖尿病与否的分类。集成方法表现最佳,处理类别不平衡对提升模型性能至关重要。