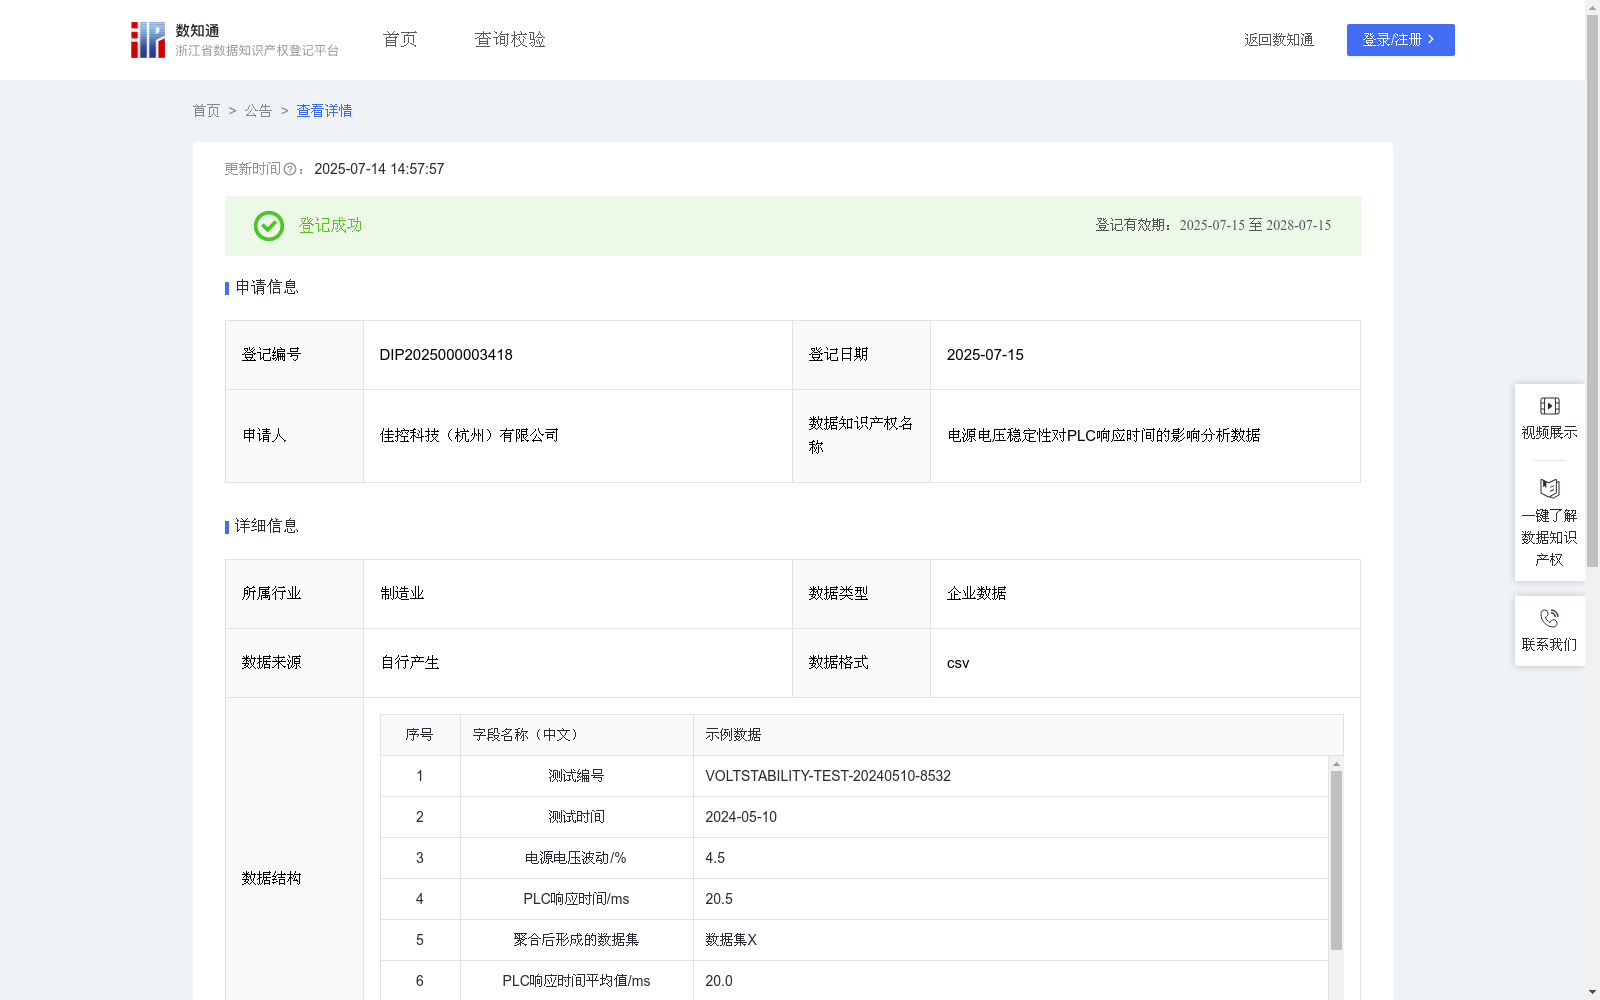
电源电压稳定性对PLC响应时间的影响分析数据
收藏浙江省数据知识产权登记平台2025-07-14 更新2025-07-15 收录
下载链接:
https://www.zjip.org.cn/home/announce/trends/148568
下载链接
链接失效反馈官方服务:
资源简介:
本研究聚焦于分析电源电压稳定性对PLC响应时间的影响,揭示了电源电压稳定性与PLC响应时间之间的定量关系。企业可通过该数据分析不同电源电压稳定性条件下PLC的响应时间变化规律,从而优化控制策略和电源管理措施,提高系统响应速度并确保稳定运行。该数据可为智能制造领域的科研人员、技术开发团队、设备维护工程师以及性能优化专家提供重要支持,助力他们围绕PLC响应时间优化、系统稳定性提升及高效生产等方向开展预测分析、机理研究、性能评估和技术改进工作。通过科学管理和改善电源电压稳定性,不仅可以实现加快PLC响应时间的目标,还能增强系统的可靠性和效率,为智能工厂的高效运作提供有力保障。1.数据采集:记录不同电源电压稳定性的PLC响应时间测试数据,具体包括测试编号、测试时间、电源电压波动/%(百分比表示电压的波动范围)、PLC响应时间/ms(毫秒)等字段。
2.数据预处理:(1)对采集的数据进行去噪处理,确保数据准确性。(2)把历史采集的数据(包含本次采集)进行聚合,形成数据集X,并针对数据集X中的PLC响应时间字段,计算出其平均值。
3.计算线性回归斜率a和截距b:基于数据集X(以电源电压波动为自变量、PLC响应时间为因变量),运用SLOPE函数和INTERCEPT函数,基于最小二乘法原理确定斜率a和截距b。斜率a表示单位电源电压波动变化对PLC响应时间的影响程度,截距b表示基准电源电压波动下PLC的响应时间。
4.结果运用:(1)计算比例系数k:k=|a/PLC响应时间平均值|×100%;(2)若k≥10%,则判定为“高影响”,若5%≤k<10%,则判定为“中影响”,若k<5%,则判定为“低影响”。
This study focuses on analyzing the impact of power voltage stability on the response time of Programmable Logic Controller (PLC), and reveals the quantitative relationship between power voltage stability and PLC response time. Enterprises can use this data to analyze the variation law of PLC response time under different power voltage stability conditions, so as to optimize control strategies and power management measures, improve system response speed and ensure stable operation. This data can provide important support for researchers, technology development teams, equipment maintenance engineers and performance optimization experts in the field of intelligent manufacturing, helping them carry out predictive analysis, mechanism research, performance evaluation and technical improvement work around the directions of PLC response time optimization, system stability improvement and efficient production. Through scientific management and improvement of power voltage stability, the goal of accelerating PLC response time can not only be achieved, but also the reliability and efficiency of the system can be enhanced, providing a strong guarantee for the efficient operation of smart factories.
1. Data Collection: Record the PLC response time test data under different power voltage stability conditions, specifically including fields such as test number, test time, power voltage fluctuation/% (the fluctuation range of voltage is expressed in percentage), and PLC response time/ms (milliseconds).
2. Data Preprocessing: (1) Denoise the collected data to ensure data accuracy. (2) Aggregate the historically collected data (including this collection) to form dataset X, and calculate the average value of the PLC response time field in dataset X.
3. Calculation of linear regression slope a and intercept b: Based on dataset X (taking power voltage fluctuation as the independent variable and PLC response time as the dependent variable), use the SLOPE and INTERCEPT functions to determine the slope a and intercept b based on the principle of least squares. The slope a represents the degree of influence of unit power voltage fluctuation change on PLC response time, and the intercept b represents the PLC response time under the reference power voltage fluctuation.
4. Application of Results: (1) Calculate the proportional coefficient k: k = |a / average PLC response time| × 100%; (2) If k ≥ 10%, it is judged as "high impact"; if 5% ≤ k < 10%, it is judged as "medium impact"; if k < 5%, it is judged as "low impact".
提供机构:
佳控科技(杭州)有限公司
创建时间:
2025-04-23
搜集汇总
数据集介绍
背景与挑战
背景概述
该数据集记录了电源电压稳定性对PLC响应时间的影响,包含589条测试数据,每日更新,适用于智能制造领域的科研和技术开发。
以上内容由遇见数据集搜集并总结生成


