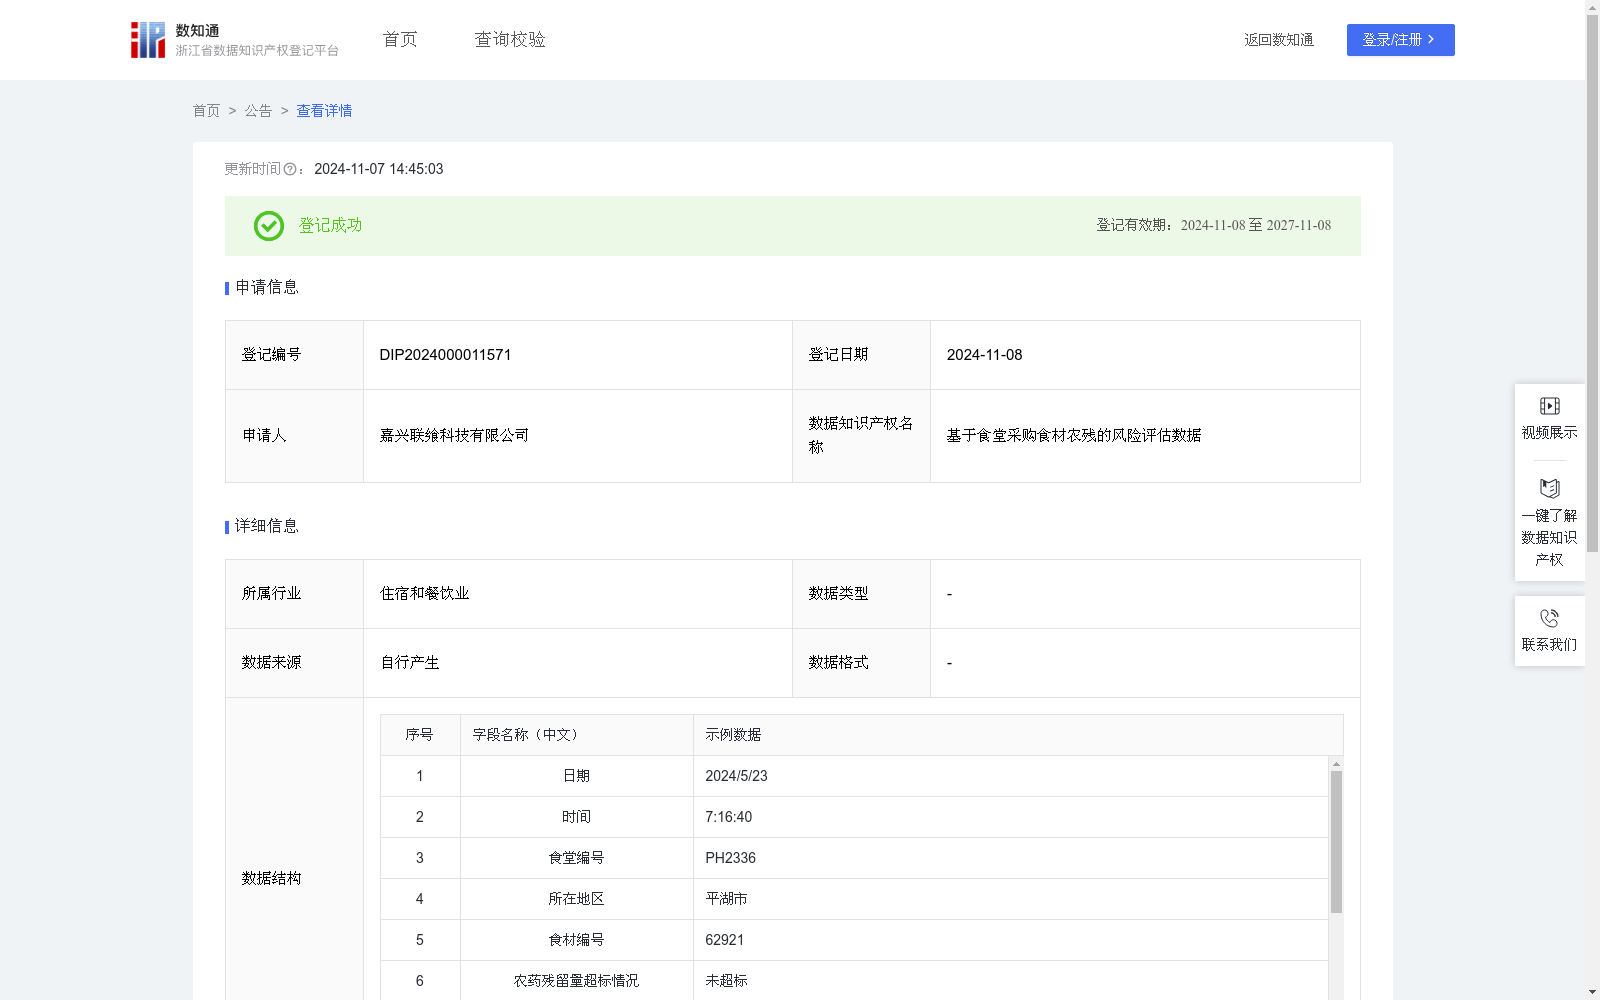
基于食堂采购食材农残的风险评估数据
收藏浙江省数据知识产权登记平台2024-11-07 更新2024-11-08 收录
下载链接:
https://www.zjip.org.cn/home/announce/trends/82130
下载链接
链接失效反馈官方服务:
资源简介:
基于食堂采购食材农残的风险评估数据是一个创新的量化工具,可用于评估采购食材的农药残留情况可能对食品安全造成的风险程度。 1.食堂可将本指数作为食品安全的日常监控工具,识别因采购食材农药残留偏高而可能造成的食品安全风险,强化食材的质量控制流程,及时调整食材的采购策略,减少高风险食材和供应商的使用和选择;食堂也可将本数据作为对食材供应商评价考核的依据之一。2.餐饮监管部门可以利用本数据作为监管食堂食品安全的依据之一,可通过指数的变化及时发现食品安全风险较高的食堂,提前进行干预和指导。3.食堂或和监管机构可以将本数据对外披露公开,体现本单位或本地区对食材来源安全的重视和承诺,有利于增强用餐者的信任。4.保险公司可根据本数据提前识别目标食堂客户的投保风险,从而确定相关保险产品的定价,如食品安全责任险。5.本数据还能为食材农残测试仪器厂家对仪器进行功能改进或提升提供依据。1.数据抽取和预处理: (1)数据抽取:在自研的5G智慧食安工业物联网数字化管理平台数据库中抽取相关食堂的采购食材的农药残留数据,包括日期、时间、食堂编号、所在地区、食材编号、农药残留量超标情况。(2)数据预处理:对抽取的数据进行清洗,去除重复、错误或无关的信息,以便后续的分析和建模。 2.基于采购食材的农残统计数据预测食堂食品安全风险: (1)计算近30日农残测试次数、超标次数和连续超标次数:利用SUM函数对近30日的测试次数进行累加;利用CountIf函数分别对近30日的超标次数和连续超标次数进行累加;(2)计算近30日农残超标率和连续超标次数占比:近30日农残超标率=近30日农残超标次数÷近30日农残测试次数×100%;近30日农残连续超标次数占比=近30日农残连续超标次数÷近30日农残测试次数×100%;(3)建立食堂食品安全风险评估模型:基于采购食材农残统计的食堂食品安全风险指数=近30日农残超标率×a+近30日农残连续超标次数占比×b;a和b为对应的系数,属于我司商业秘密,故不作详细列举。
The pesticide residue risk assessment data for canteen procurement ingredients is an innovative quantitative tool for evaluating the potential risk to food safety posed by pesticide residues in purchased ingredients.
1. Canteens can use this index as a daily food safety monitoring tool to identify potential food safety risks caused by excessively high pesticide residues in purchased ingredients, strengthen the quality control process of ingredients, adjust ingredient procurement strategies in a timely manner, and reduce the use and selection of high-risk ingredients and suppliers. They can also take this data as one of the bases for evaluating and assessing food ingredient suppliers.
2. Food safety regulatory authorities can use this data as one of the bases for supervising canteen food safety, identify canteens with relatively high food safety risks in a timely manner through changes in the index, and conduct early intervention and guidance.
3. Canteens or regulatory agencies can publicly disclose this data to demonstrate their emphasis on and commitment to the safety of ingredient sources, which helps enhance the trust of diners.
4. Insurance companies can use this data to identify the underwriting risks of target canteen customers in advance, so as to determine the pricing of relevant insurance products such as food safety liability insurance.
5. This data can also provide a basis for pesticide residue testing instrument manufacturers to improve or upgrade the functions of their instruments.
1. Data extraction and preprocessing:
(1) Data extraction: Extract pesticide residue data of purchased ingredients from relevant canteens from the database of the self-developed 5G Smart Food Safety Industrial Internet of Things (IIoT) digital management platform, including date, time, canteen number, location, ingredient number, and whether the pesticide residue amount exceeds the standard.
(2) Data preprocessing: Clean the extracted data to remove duplicate, erroneous or irrelevant information for subsequent analysis and modeling.
2. Prediction of canteen food safety risk based on pesticide residue statistical data of purchased ingredients:
(1) Calculate the number of pesticide residue tests, the number of exceeding-standard tests and the number of consecutive exceeding-standard tests in the past 30 days: Use the SUM function to accumulate the total number of tests in the past 30 days; use the CountIf function to accumulate the number of exceeding-standard tests and the number of consecutive exceeding-standard tests in the past 30 days respectively.
(2) Calculate the pesticide residue exceeding-standard rate and the proportion of consecutive exceeding-standard tests in the past 30 days:
Pesticide residue exceeding-standard rate in the past 30 days = (Number of pesticide residue exceeding-standard tests in the past 30 days ÷ Total number of pesticide residue tests in the past 30 days) × 100%;
Proportion of consecutive pesticide residue exceeding-standard tests in the past 30 days = (Number of consecutive pesticide residue exceeding-standard tests in the past 30 days ÷ Total number of pesticide residue tests in the past 30 days) × 100%;
(3) Establish a canteen food safety risk assessment model:
Canteen food safety risk index based on pesticide residue statistics of purchased ingredients = (Pesticide residue exceeding-standard rate in the past 30 days × a) + (Proportion of consecutive pesticide residue exceeding-standard tests in the past 30 days × b);
a and b are corresponding coefficients, which are trade secrets of our company and thus will not be detailedly listed.
提供机构:
嘉兴联飨科技有限公司
创建时间:
2024-10-16
搜集汇总
数据集介绍
特点
该数据集是一个用于评估食堂采购食材农药残留风险的量化工具,包含584条每日更新的记录,适用于食品安全监控、监管和保险风险评估等多个场景。
以上内容由遇见数据集搜集并总结生成


