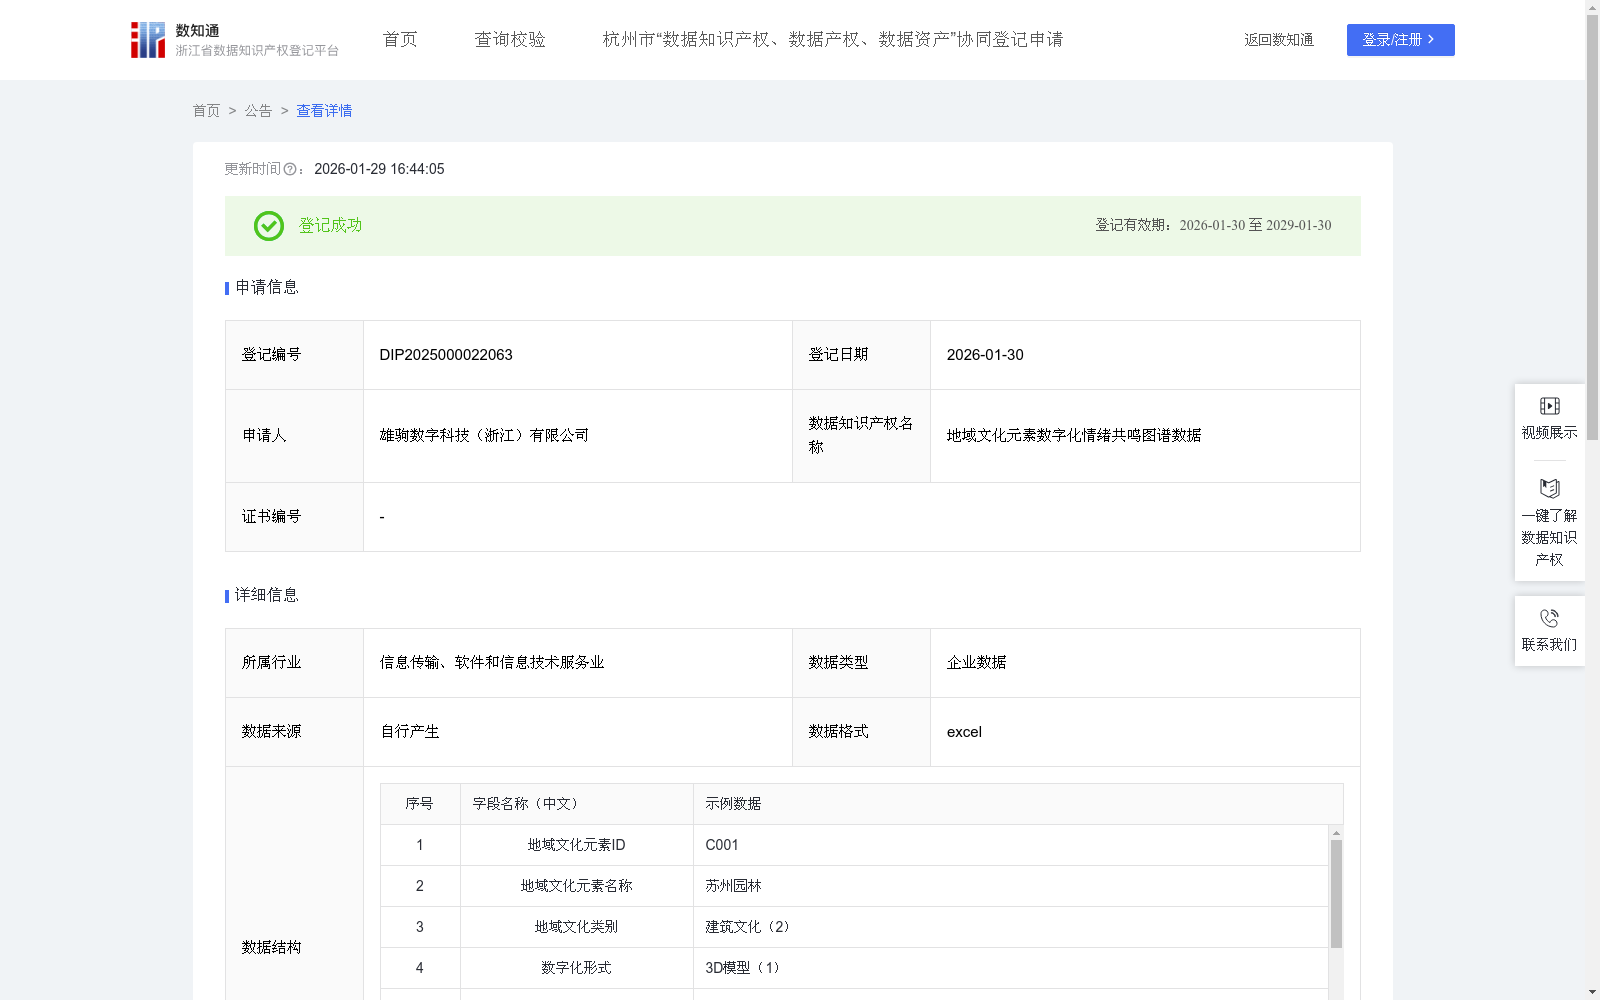
地域文化元素数字化情绪共鸣图谱数据
收藏资源简介:
本数据集适用于地域文化数字化传播、文旅IP开发、文创产品设计、数字媒体内容制作等领域,适用条件为需基于量化数据挖掘地域文化元素与用户情绪的关联关系,提升文化传播效果或商业转化价值的场景。适用范围覆盖全国34个省级行政区(含直辖市、自治区、特别行政区)的地域文化领域,服务对象包括: 文旅运营企业(景区、文旅集团):用于打造量化情绪共鸣的沉浸式体验项目(如数字文化展馆、文化主题VR场景); 文创开发企业:辅助设计高情绪适配度的文创产品(如结合“敦煌壁画”情绪指数的文具、饰品); 数字媒体与广告机构:制作贴合用户情绪偏好的地域文化内容(如地方文旅宣传视频、地域品牌广告); 文化管理机构(博物馆、地方文旅局):用于地域文化数字化档案建设与传播效果评估。 可解决的核心问题:通过多维度量化指标,破解“地域文化元素应用缺乏情绪数据支撑”的痛点,避免文化元素滥用导致的传播低效问题,帮助用户精准判断某类文化元素的情绪感染力,提升地域文化传播的精准度与商业价值(如预估某非遗元素转化为文旅IP的用户接受度)。1.数据采集:全程基于企业自有系统自动化采集 2.数据处理:数据清洗:由企业自有数据清洗系统自动执行,规则包括:去除异常值;去重处理;补全缺失值;数值归一化:对用户交互频次(企业自有系统统计的最大值1000次/天、最小值10次/天)、平均停留时长(最大值300秒、最小值10秒)进行0-10的归一化处理,公式为:归一化值=(原始值-最小值)/(最大值-最小值)×10,结果保留1位小数;隐私保护:对用户ID进行匿名化处理。 3.算法加工 采用企业自主研发的“地域文化元素-情绪共鸣”量化模型,核心逻辑与公式如下,模型参数已在企业自有系统内固化: 权重设定:基于企业自有数据库历史文化传播案例数据训练、结合企业内部文化专家与算法工程师联合评估,确定核心因子权重(权重总和为1): 情绪共鸣度评分权重:0.4(核心情绪量化指标,直接反映用户对元素的情绪反馈强度); 归一化交互频次权重:0.25(反映用户对文化元素的关注热度,热度越高越易产生情绪共鸣); 归一化停留时长权重:0.2(反映用户对文化元素的兴趣深度,停留越久情绪感知越充分); 地域文化元素代表性权重:0.15(基于企业自有文化元素评级体系,国家级非遗=10分、省级=8分、市级=6分,归一化后计算,反映元素文化价值对情绪共鸣的加持作用); 共鸣图谱匹配指数P计算公式:P=(情绪共鸣度评分×0.4+归一化交互频次×0.25+归一化停留时长×0.2+归一化代表性得分×0.15)×地域适配系数。其中,地域适配系数根据企业自有地域用户数据库中的用户基数调整(取值0.9-1.2:用户基数超1000万的地域取1.2,不足100万的取0.9),通过企业自有系统内200+个地域的用户反馈数据校准,计算误差率≤3%,结果保留1位小数。 4.数据分类分级:根据“共鸣图谱匹配指数P(0-10分)”划分量化共鸣等级,等级标准固化于企业自有系统,结果可直接用于业务决策: 高共鸣:P≥6.0(情绪匹配度极高,适合作为核心文旅IP、文创产品主元素,基于企业历史数据预估用户接受度≥85%); 中共鸣:5.0≤P<6.0(情绪匹配度良好,可作为辅助元素使用,预估用户接受度60%-85%); 低共鸣:P<5.0(情绪匹配度低,需优化数字化形式或更换元素,预估用户接受度<60%)。
This dataset is applicable to fields including digital dissemination of regional culture, cultural and tourism IP development, cultural and creative product design, digital media content production, etc., for scenarios where it is necessary to mine the correlation between regional cultural elements and user emotions based on quantitative data to improve cultural dissemination effects or commercial conversion value. Its scope covers the regional cultural fields of the 34 provincial-level administrative regions of China (including municipalities directly under the Central Government, autonomous regions, and special administrative regions). The target service objects include: 1. Cultural and tourism operation enterprises (scenic spots, cultural and tourism groups): used to create immersive experience projects with quantified emotional resonance (such as digital cultural exhibition halls, cultural-themed VR scenes); 2. Cultural and creative development enterprises: to assist in designing cultural and creative products with high emotional adaptability (such as stationery and jewelry combined with the "Dunhuang Murals" emotion index); 3. Digital media and advertising agencies: to produce regional cultural content that fits user emotional preferences (such as local cultural and tourism promotional videos, regional brand advertisements); 4. Cultural management institutions (museums, local cultural and tourism bureaus): used for the construction of regional cultural digital archives and the evaluation of dissemination effects. Core issues that can be solved: Through multi-dimensional quantitative indicators, this dataset addresses the pain point that "the application of regional cultural elements lacks emotional data support", avoids the problem of inefficient dissemination caused by the overuse of cultural elements, helps users accurately judge the emotional appeal of a certain type of cultural elements, and improves the accuracy and commercial value of regional cultural dissemination (such as estimating the user acceptance of an intangible cultural heritage element transformed into a cultural and tourism IP). 1. Data Collection: Fully automated collection based on the enterprise's own internal systems. 2. Data Processing: - Data Cleaning: Automatically executed by the enterprise's own data cleaning system, with rules including removing outliers, deduplication, and filling missing values. - Numerical Normalization: Normalize user interaction frequency (with a maximum of 1000 times/day and minimum of 10 times/day counted by the enterprise's own system) and average stay duration (maximum 300 seconds, minimum 10 seconds) to a range of 0-10. The formula is: Normalized value = (original value - minimum value) / (maximum value - minimum value) × 10, with the result rounded to 1 decimal place. - Privacy Protection: Anonymize user IDs. 3. Algorithm Processing This dataset adopts the "Regional Cultural Elements - Emotional Resonance" quantitative model independently developed by the enterprise, with the core logic and formulas as follows, and the model parameters have been fixed in the enterprise's own internal system: - Weight Setting: The weights of core factors (with a total weight of 1) are determined based on training on historical cultural dissemination case data from the enterprise's own database, combined with joint evaluations from internal cultural experts and algorithm engineers of the enterprise: - Weight of Emotional Resonance Score: 0.4 (core quantitative emotional indicator, directly reflecting the intensity of user emotional feedback towards elements); - Weight of Normalized Interaction Frequency: 0.25 (reflecting the user's attention to cultural elements; the higher the attention, the easier it is to generate emotional resonance); - Weight of Normalized Stay Duration: 0.2 (reflecting the user's interest depth in cultural elements; the longer the stay, the more sufficient the emotional perception); - Weight of Regional Cultural Element Representativeness: 0.15 (based on the enterprise's own cultural element rating system, national-level intangible cultural heritage (ICH) = 10 points, provincial-level = 8 points, municipal-level = 6 points, calculated after normalization, reflecting the supporting effect of the cultural value of elements on emotional resonance); - Formula for Resonance Map Matching Index P: P = (Emotional Resonance Score × 0.4 + Normalized Interaction Frequency × 0.25 + Normalized Stay Duration × 0.2 + Normalized Representativeness Score × 0.15) × Regional Adaptation Coefficient. The regional adaptation coefficient is adjusted according to the user base in the enterprise's own regional user database (value range: 0.9-1.2: 1.2 for regions with a user base exceeding 10 million, 0.9 for regions with a user base less than 1 million). It is calibrated through user feedback data from more than 200 regions in the enterprise's own system, with a calculation error rate ≤ 3%, and the result is rounded to 1 decimal place. 4. Data Classification and Grading Quantitative resonance levels are divided based on the "Resonance Map Matching Index P (0-10 points)", and the grading standards are fixed in the enterprise's own system, with the results directly usable for business decision-making: - High Resonance: P ≥ 6.0 (extremely high emotional matching degree, suitable as the core element of core cultural and tourism IP and cultural and creative products; based on enterprise historical data, the estimated user acceptance is ≥ 85%); - Medium Resonance: 5.0 ≤ P < 6.0 (good emotional matching degree, can be used as auxiliary elements; estimated user acceptance is 60%-85%); - Low Resonance: P < 5.0 (low emotional matching degree, need to optimize the digital form or replace the element; estimated user acceptance is < 60%).