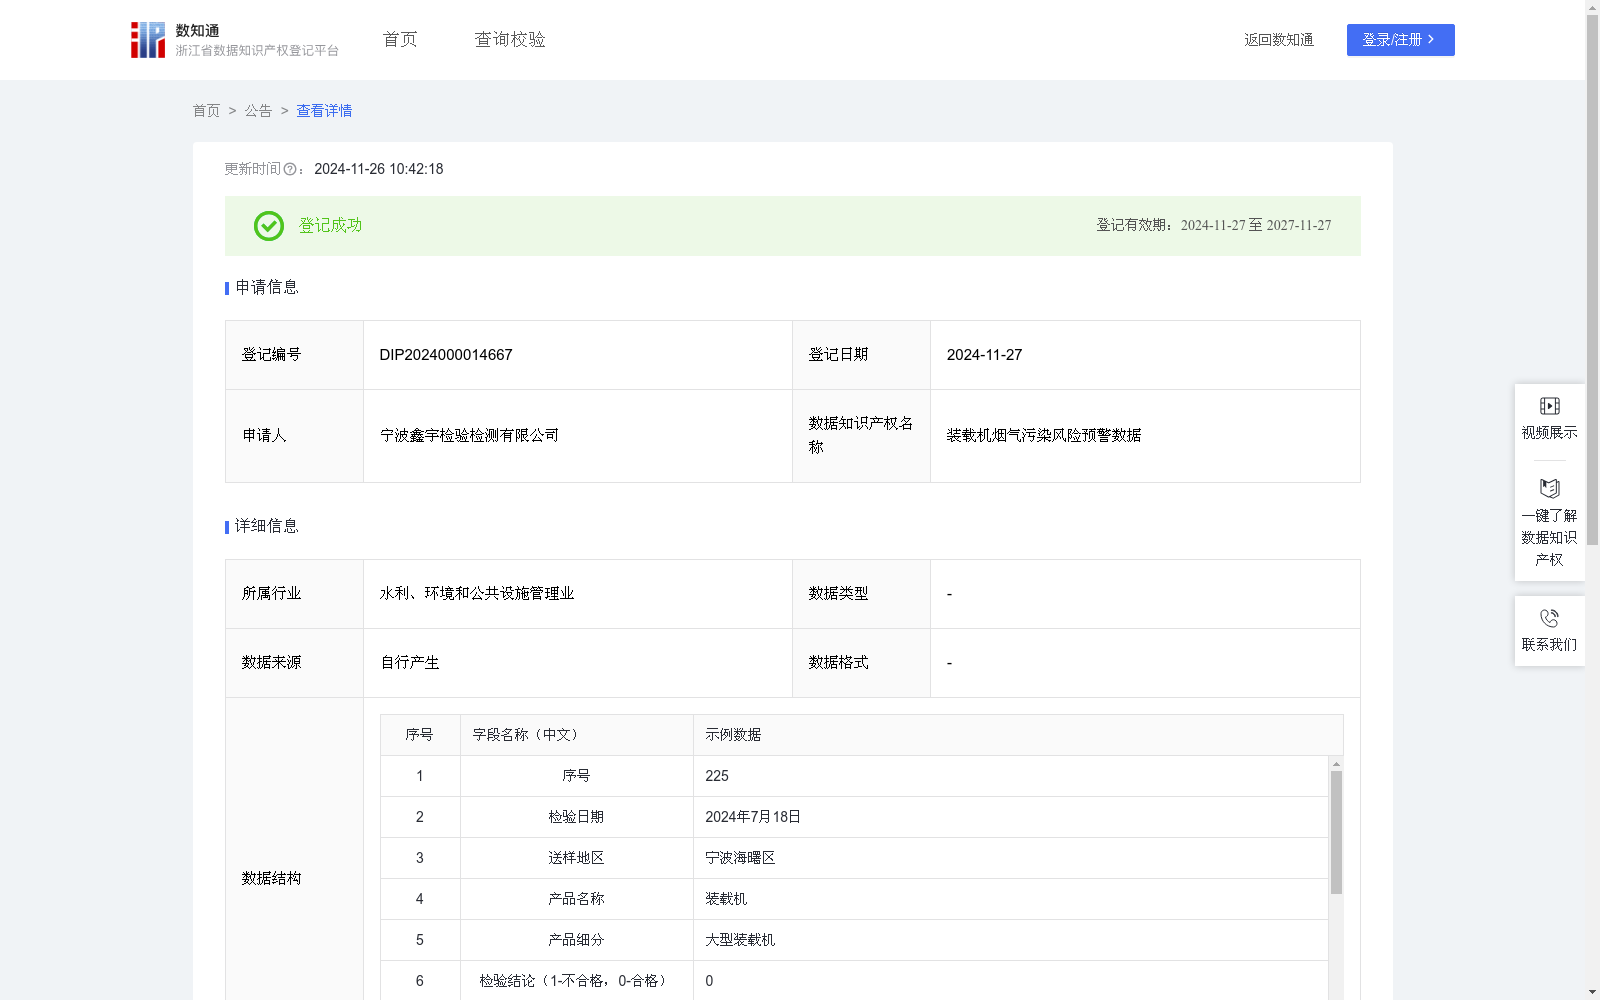
装载机烟气污染风险预警数据
收藏资源简介:
装载机是非道路移动源污染物排放的主要来源之一。烟气污染风险预警数据是一个创新的量化工具,用于评估当前市场上流通的装载机在烟气排放方面可能出现的污染风险程度并进行预警。1.装载机行业内的生产企业可以通过本数据了解当前市场上不同装载机烟气排放污染的整体情况,来优化生产流程和控制烟气污染。通过结合潜在风险因素的分析,企业能够及时调整并改进发动机和排放控制系统,加强排放监控点的监控,从而降低排放超标率和环保处罚风险,提高产品在市场上的竞争力。2.环保监管部门可以利用本数据识别和跟踪不同装载机烟气排放潜在的污染问题,及时采取监管措施,如发出环保警告、加强检查和执法力度,确保市场上流通的产品符合环保标准。环保监管部门还可以将本数据对外披露公开,体现政府和本区域对装载机烟气污染控制的重视和承诺,有利于增强公众的信任。 1.数据采集和预处理: (1)数据采集:采集装载机每次送检结果数据,包括序号、检验日期、送样地区、产品名称、产品细分、检验结论。(2)数据预处理:对采集的数据进行清洗,将检验结论不合格、合格分别用1、0代替,以便后续分析和建模。 2.数据加工和分析: (1)计算装载机烟气排放情况近30次检验的累计不合格次数及不合格率、最高连续不合格次数及其占比:用SUM函数计算近30次累计不合格次数;用CountIf函数和MAX函数嵌套确定近30次最高连续不合格次数;近30次累计不合格率=近30次累计不合格次数÷30×100%;近30次最高连续不合格次数占比=近30次最高连续不合格次数÷30×100%; (2)建立预测预警模型:①计算每次检验后的烟气污染风险评分=近30次累计不合格率×100×0.6+近30次最高连续不合格次数占比×100×0.4;②利用AVERAGE函数计算近10次烟气污染风险评分平均得分,并进行风险等级判定:平均得分≤5,为低风险;5<平均得分≤10,为中风险;平均得分>10,为高风险;④预警等级采用便于目视化管理方式,划分为绿色(低风险)、黄色(中风险)、红色(高风险)。
Loaders are one of the main sources of pollutant emissions from non-road mobile sources. This smoke pollution risk early warning data is an innovative quantitative tool used to assess and issue early warnings regarding the potential pollution risk level of smoke emissions from loaders circulating in the current market. 1. Production enterprises in the loader industry can use this data to understand the overall smoke emission pollution status of different loaders circulating in the market, so as to optimize production processes and control smoke pollution. By combining the analysis of potential risk factors, enterprises can timely adjust and improve their engines and emission control systems, strengthen monitoring at emission monitoring points, thereby reducing emission non-compliance rates and the risk of environmental penalties, and improving the competitiveness of their products in the market. 2. Environmental protection regulatory authorities can use this data to identify and track potential pollution issues related to smoke emissions from different loaders, and take regulatory measures in a timely manner, such as issuing environmental warnings, strengthening inspections and law enforcement, to ensure that products circulating in the market meet environmental protection standards. Environmental protection regulatory authorities can also disclose this data publicly, demonstrating the government and the region's attention to and commitment to smoke pollution control of loaders, which is conducive to enhancing public trust. 1. Data collection and preprocessing: (1) Data collection: Collect the test result data of each loader, including serial number, inspection date, sample submission region, product name, product segment, and inspection conclusion. (2) Data preprocessing: Clean the collected data, replace unqualified and qualified inspection conclusions with 1 and 0 respectively, to facilitate subsequent analysis and modeling. 2. Data processing and analysis: (1) Calculate the cumulative number of non-compliant tests and non-compliance rate of the last 30 smoke emission inspections, the maximum consecutive non-compliant times and its proportion: Use the SUM function to calculate the cumulative number of non-compliant tests in the last 30 times; Use nested CountIf and MAX functions to determine the maximum consecutive non-compliant times in the last 30 times; The cumulative non-compliance rate of the last 30 times = (cumulative number of non-compliant tests in the last 30 times ÷ 30) × 100%; The proportion of maximum consecutive non-compliant times in the last 30 times = (maximum consecutive non-compliant times in the last 30 times ÷ 30) × 100%; (2) Establish a prediction and early warning model: ① Calculate the smoke pollution risk score after each inspection = cumulative non-compliance rate of the last 30 times × 100 × 0.6 + proportion of maximum consecutive non-compliant times in the last 30 times × 100 × 0.4; ② Calculate the average score of the smoke pollution risk scores of the last 10 times using the AVERAGE function, and determine the risk level: average score ≤ 5, low risk; 5 < average score ≤ 10, medium risk; average score > 10, high risk; ④ The early warning levels are classified into green (low risk), yellow (medium risk), and red (high risk) for easy visual management.