物流运输碳排放预测数据
收藏浙江省数据知识产权登记平台2025-07-14 更新2025-07-15 收录
下载链接:
https://www.zjip.org.cn/home/announce/trends/148719
下载链接
链接失效反馈官方服务:
资源简介:
该数据在物流运输碳排放预测中具有重要的应用价值。能够提供碳排放定量分析,更精确地评估运输过程中的能耗与排放水平,帮助企业和监管机构进行绿色物流管理与碳足迹追踪。在物流运输领域具有广泛的应用场景,特别是跨城市干线运输、城市配送路径优化和碳交易配额计算,能够提高碳排放可视化程度,降低碳排放测算成本,提供精准的碳排放控制依据。数据收集:
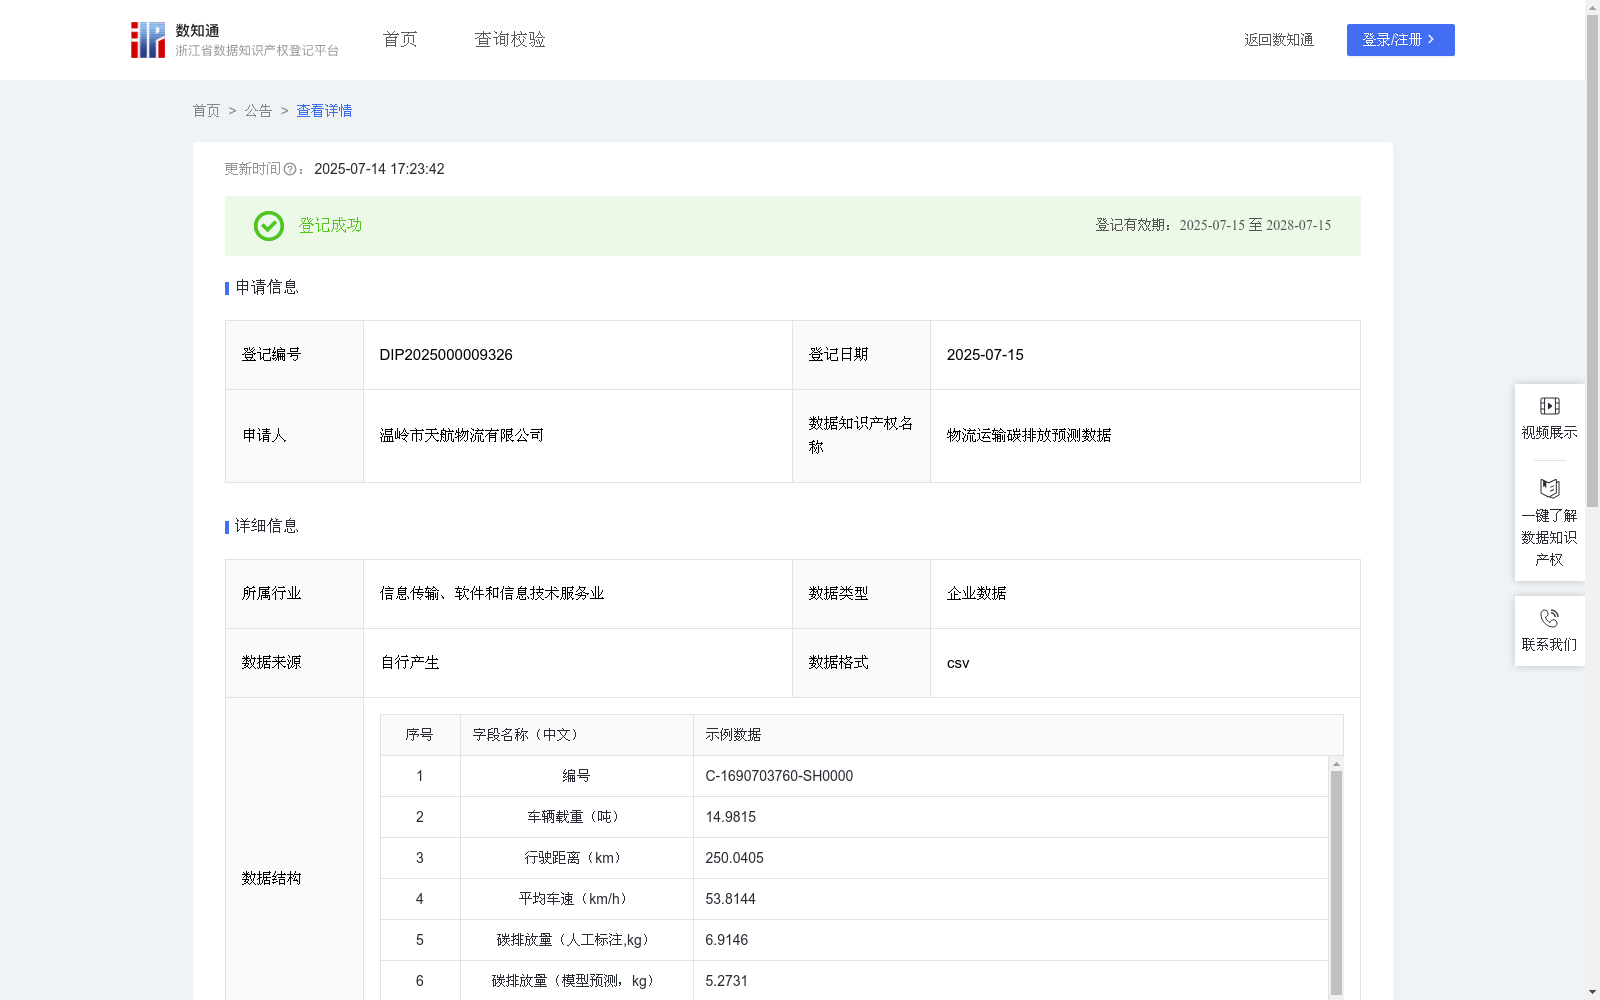
本模型所用数据来自车载物联网设备、运输管理系统(TMS)和油耗监测平台。每条记录包含“车辆载重”、“行驶距离”和“平均速度”等基本运输参数,同时记录了“碳排放量(人工标注)”作为目标输出数据,采用第三方碳排放因子数据库(如国家标准或IPCC指南)进行标注。
数据预处理:
首先对“车辆载重”和“行驶距离”进行最大最小归一化处理,以提升模型收敛速度;“平均速度”则通过标准差归一化处理以平衡其对碳排放的影响。针对不同车型和路线,进行编码并转化为嵌入向量。此外,样本按运输时间顺序构建滑动窗口序列,用于建模碳排放的历史依赖性。
模型构建:
采用双层长短期记忆网络(LSTM)对运输过程中多时刻的输入变量进行建模,输出预测的“碳排放量(模型预测)”。模型核心由输入嵌入层、LSTM序列建模层和全连接回归层构成。
预测过程如下:时序建模公式:h_t = LSTM(x_t, h_{t-1})。其中,x_t 为第 t 时刻的输入特征向量(包含“车辆载重”、“行驶距离”、“平均速度”),h_t 为 LSTM 输出的隐藏状态。碳排放预测公式:ŷ = W · h_T + b。其中,h_T 为最后一个时间步的 LSTM 输出,W 为权重矩阵,b 为偏置项,ŷ 为模型输出的预测“碳排放量(模型预测)”。训练目标为最小化预测值与真实值之间的均方误差(MSE),并通过“平均绝对误差(MAE)”与“拟合优度(R²)”对模型预测性能进行评估。
该模型能够根据不同运输条件下的输入参数,实时输出预估的碳排放水平,为企业提供按单计算碳足迹的能力,便于绿色运营与政策响应。
This dataset holds significant application value in carbon emission prediction for logistics transportation. It enables quantitative analysis of carbon emissions, allowing for more accurate assessment of energy consumption and emission levels during transportation, and helps enterprises and regulatory agencies carry out green logistics management and carbon footprint tracking.
It has a wide range of application scenarios in the logistics transportation field, especially in cross-city trunk line transportation, urban distribution route optimization, and carbon trading quota calculation. It can improve the visualization of carbon emissions, reduce the cost of carbon emission measurement, and provide a precise basis for carbon emission control.
### Data Collection:
The data used in this model is sourced from on-board IoT devices, Transportation Management System (TMS), and fuel consumption monitoring platforms. Each record includes basic transportation parameters such as "vehicle load", "travel distance", and "average speed", while recording "carbon emissions (manually labeled)" as the target output data. The labeling is carried out using third-party carbon emission factor databases (such as national standards or IPCC guidelines).
### Data Preprocessing:
First, min-max normalization is applied to "vehicle load" and "travel distance" to accelerate model convergence; "average speed" is processed via standardization (standard score normalization) to balance its impact on carbon emissions. Encoding is performed for different vehicle types and routes, and the results are converted into embedding vectors. In addition, samples are constructed into sliding window sequences according to the transportation time order to model the historical dependence of carbon emissions.
### Model Construction:
A two-layer Long Short-Term Memory (LSTM) network is adopted to model the multi-timestep input variables during transportation, and output the predicted "carbon emissions (model prediction)". The core of the model consists of an input embedding layer, an LSTM sequence modeling layer, and a fully connected regression layer.
The prediction process is as follows:
Time-series modeling formula: $h_t = LSTM(x_t, h_{t-1})$, where $x_t$ is the input feature vector at the t-th timestep (including "vehicle load", "travel distance", and "average speed"), and $h_t$ is the hidden state output by the LSTM.
Carbon emission prediction formula: $hat{y} = W cdot h_T + b$, where $h_T$ is the LSTM output at the last timestep, $W$ is the weight matrix, $b$ is the bias term, and $hat{y}$ is the predicted "carbon emissions (model prediction)" output by the model.
The training objective is to minimize the mean squared error (MSE) between the predicted value and the true value, and the model's prediction performance is evaluated using mean absolute error (MAE) and coefficient of determination ($R^2$).
This model can output the estimated carbon emission level in real time based on input parameters under different transportation conditions, providing enterprises with the ability to calculate carbon footprints for individual orders, facilitating green operations and policy response.
提供机构:
温岭市天航物流有限公司
创建时间:
2025-06-25
搜集汇总
数据集介绍
背景与挑战
背景概述
该数据集由温岭市天航物流有限公司提供,包含4837条物流运输碳排放相关数据,格式为CSV。数据字段包括车辆载重、行驶距离、平均车速等,用于预测碳排放量,应用场景包括物流运输碳排放预测、路径优化和碳交易配额计算。
以上内容由遇见数据集搜集并总结生成


