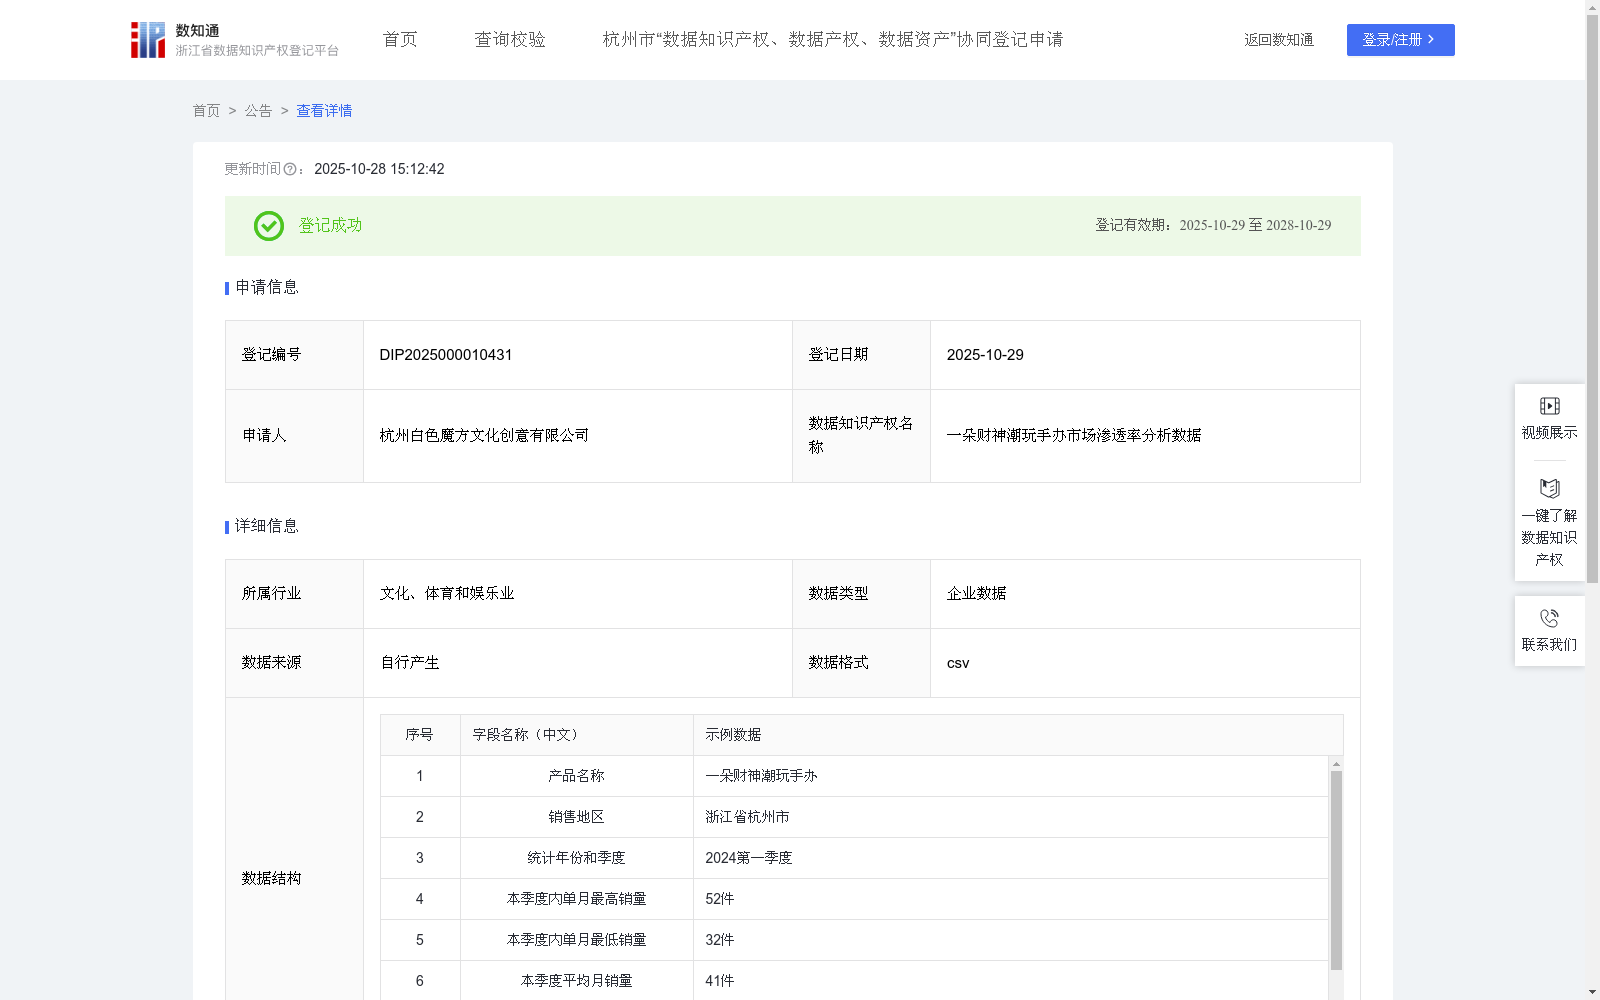
一朵财神潮玩手办市场渗透率分析数据
收藏资源简介:
市场渗透率通常定义为特定产品在潜在市场中的占有率。对一朵财神潮玩手办在不同地区的市场渗透率进行分析,对于理解财神主题盲盒在各地区的市场发展趋势、识别产品在不同区域的增长机会和潜在风险、指导厂商对产品线的优化调整以及营销资源精准投放,具有重要的统计意义和实际应用价值。本数据也可为文创产品供应商、礼品零售商及其他相关企业在市场进入、产品配套、合作策略等方面提供决策参考。1.数据采集:收集公司财神盲盒产品在不同地区的销售数据,包括产品名称、销售地区、统计年份和季度、本季度内单月最高销量、本季度内单月最低销量、本季度平均月销量等字段。 2.数据预处理: 对采集的数据进行清洗,去除重复或缺失的数据记录。 3.建立市场渗透率分析模型: (1)计算本季度月均潜在销量:本季度月均潜在销量=本季度内单月最高销量-本季度内单月最低销量+本季度平均月销量; (2)计算本季度月均市场渗透率:本季度月均市场渗透率=(本季度平均月销量/本季度月均潜在销量)*100%; (3)市场渗透率分析: 基于计算出的市场渗透率,根据地区划分不同的类别和级别,≥90%以上标记为"市场渗透率高",50%-90%区间(不含50%和90%)内标记为"市场渗透率中等",≤50%标记为"市场渗透率低"。
Market penetration is typically defined as the share of a specific product in its potential target market. Analyzing the market penetration of Fortune God-themed trendy collectible figurines across different regions holds important statistical significance and practical application value for understanding the market development trends of Fortune God-themed blind boxes in various regions, identifying growth opportunities and potential risks of the product in different areas, guiding manufacturers to optimize and adjust their product lines, and precisely allocate marketing resources. This dataset can also provide decision-making references for cultural and creative product suppliers, gift retailers and other relevant enterprises in terms of market entry, product matching, cooperation strategies and other aspects. 1. Data Collection: Collect the sales data of the company's Fortune God-themed blind box products across different regions, including fields such as product name, sales region, statistical year and quarter, the highest monthly sales volume in the current quarter, the lowest monthly sales volume in the current quarter, and the average monthly sales volume in the current quarter. 2. Data Preprocessing: Clean the collected data to remove duplicate or missing data records. 3. Establishment of Market Penetration Analysis Model: (1) Calculation of average monthly potential sales volume in the current quarter: Average monthly potential sales volume in the current quarter = Highest monthly sales volume in the current quarter - Lowest monthly sales volume in the current quarter + Average monthly sales volume in the current quarter; (2) Calculation of average monthly market penetration rate in the current quarter: Average monthly market penetration rate in the current quarter = (Average monthly sales volume in the current quarter / Average monthly potential sales volume in the current quarter) * 100%; (3) Market Penetration Rate Analysis: Based on the calculated market penetration rate, classify regions into different categories and levels: mark regions with a rate ≥90% as "High Market Penetration", those with a rate between 50% and 90% (excluding 50% and 90%) as "Medium Market Penetration", and those with a rate ≤50% as "Low Market Penetration".