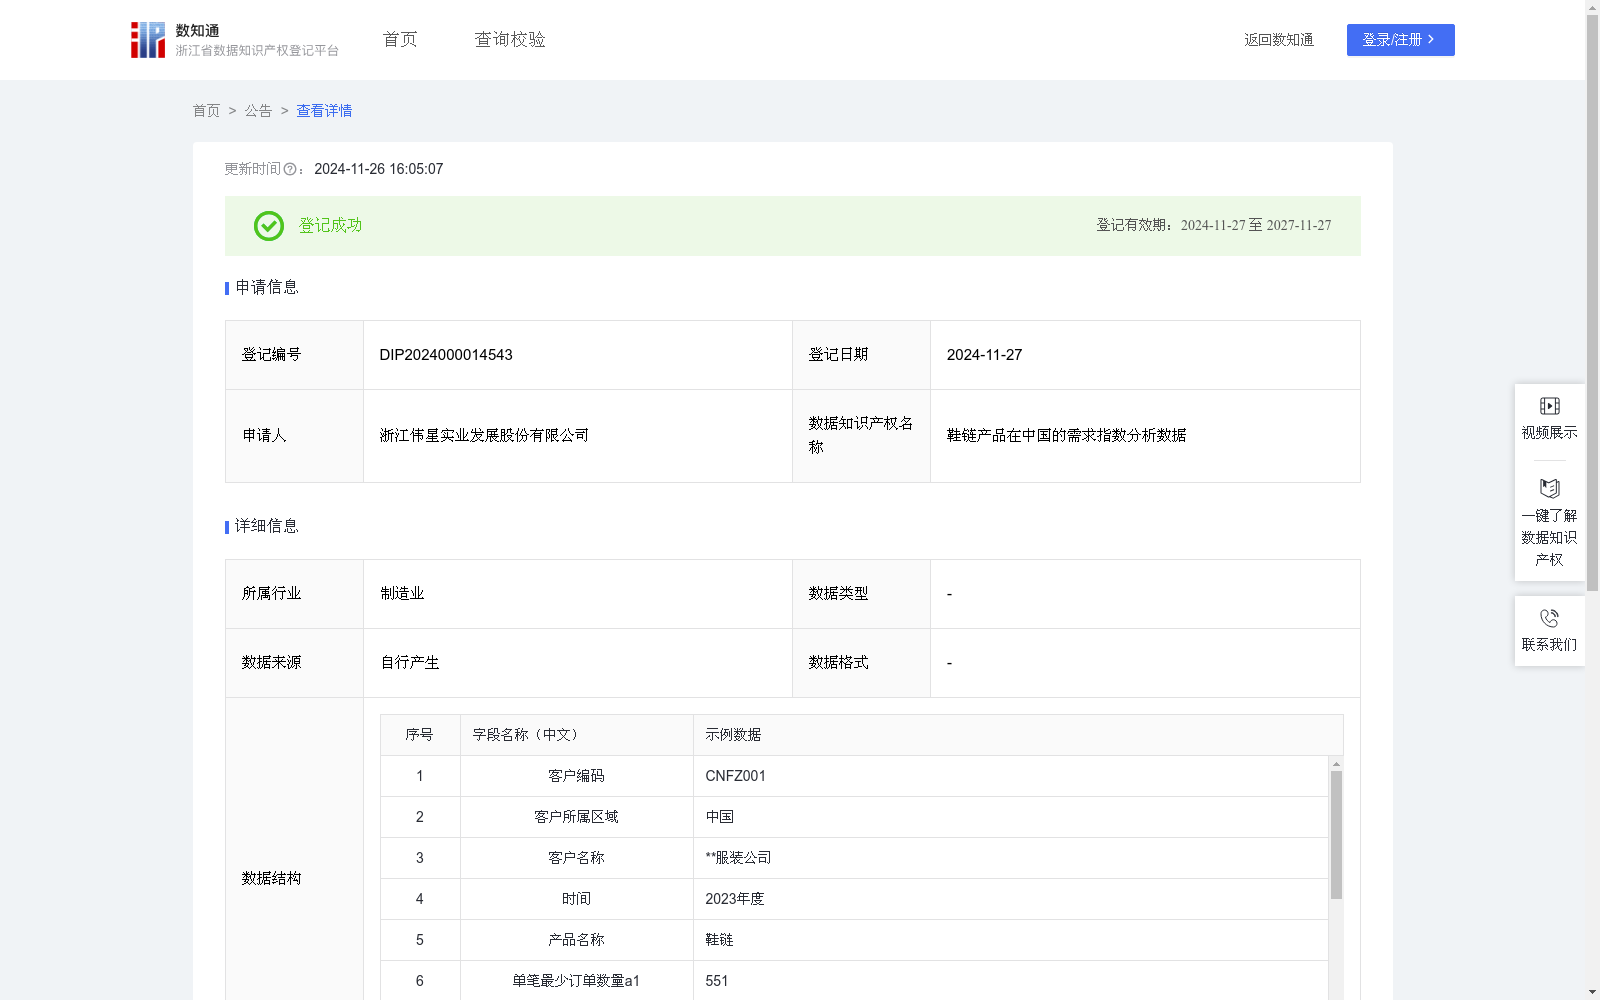
鞋链产品在中国的需求指数分析数据
收藏浙江省数据知识产权登记平台2024-11-26 更新2024-11-27 收录
下载链接:
https://www.zjip.org.cn/home/announce/trends/89462
下载链接
链接失效反馈官方服务:
资源简介:
鞋链以各种适配的金属、皮革等原料制成、款式丰富,广泛应用于运动鞋、皮鞋、休闲鞋等各类鞋类产品。公司通过收集和分析目标国家区域客户对鞋链产品的需求指数相关数据,了解客户对鞋链的需求量、购买力和消费偏好,以及了解该类商品在目标国家区域是否畅销,对不同级别的客户可采取不同的营销策略,从而为企业提供更为精准的生产及营销决策分析。该项数据分析对拉链行业所有企业都具有重要的参考意义,在行业内有极大的具有推广价值。1.数据采集:采集目标国家区域客户对鞋链的需求量的相关销售数据。
2.数据处理:对采集到数据进行分类加工、合并累加、脱敏清洗,便于分析使用。
3.数据运算:将处理后的数据按照如下算法公式进行运算:需求指数P={a1(单笔最少订单数量)/b1(单笔最少消费额)+a2(单笔最高订单数量)/b2(单笔最高消费额)+a3(平均订单数量)/b3(平均消费额)}*k,其中k为消费系数,根据目标区域的实际市场情况进行取值,按分析取k值为0.6。
4、数据分级:根据计算出的需求指数P,将客户进行分级。若P≥100,则标记为A级客户;若60≤P<100,则标记为B级客户;若20≤P<60,则标记为C级客户;若P<20,则标记为D级客户。根据客户的级别可制定相应的营销策略。
Shoe chains are made from various suitable raw materials including metal, leather and other materials, with diverse styles, and are widely applied to various footwear products such as sports shoes, leather shoes, casual shoes and more. The company collects and analyzes data related to customer demand indexes for shoe chain products in target countries and regions, so as to gain insights into customers' demand volume, purchasing power and consumption preferences for shoe chains, as well as the market sales of such commodities in the target regions. Different marketing strategies can be adopted for customers at different levels, thereby providing more accurate production and marketing decision-making analysis for the enterprise.
This data analysis is of important reference significance for all enterprises in the zipper industry and has great promotional value within the industry.
1. Data Collection: Collect relevant sales data regarding the demand for shoe chains from customers in target countries and regions.
2. Data Processing: Classify, process, consolidate, accumulate, desensitize and clean the collected data to facilitate subsequent analysis and utilization.
3. Data Calculation: Calculate the processed data using the following algorithm formula:
Demand Index P = {a1 (minimum single-order quantity)/b1 (minimum single-order consumption amount) + a2 (maximum single-order quantity)/b2 (maximum single-order consumption amount) + a3 (average order quantity)/b3 (average consumption amount)} * k
Where k is the consumption coefficient, which is determined based on the actual market situation of the target region. For this analysis, the value of k is set to 0.6.
4. Data Grading: Grade customers based on the calculated demand index P. If P ≥ 100, mark as Class A customers; if 60 ≤ P < 100, mark as Class B customers; if 20 ≤ P < 60, mark as Class C customers; if P < 20, mark as Class D customers. Corresponding marketing strategies can be formulated according to the customer's grade.
提供机构:
浙江伟星实业发展股份有限公司
创建时间:
2024-11-02
搜集汇总
数据集介绍
以上内容由遇见数据集搜集并总结生成


