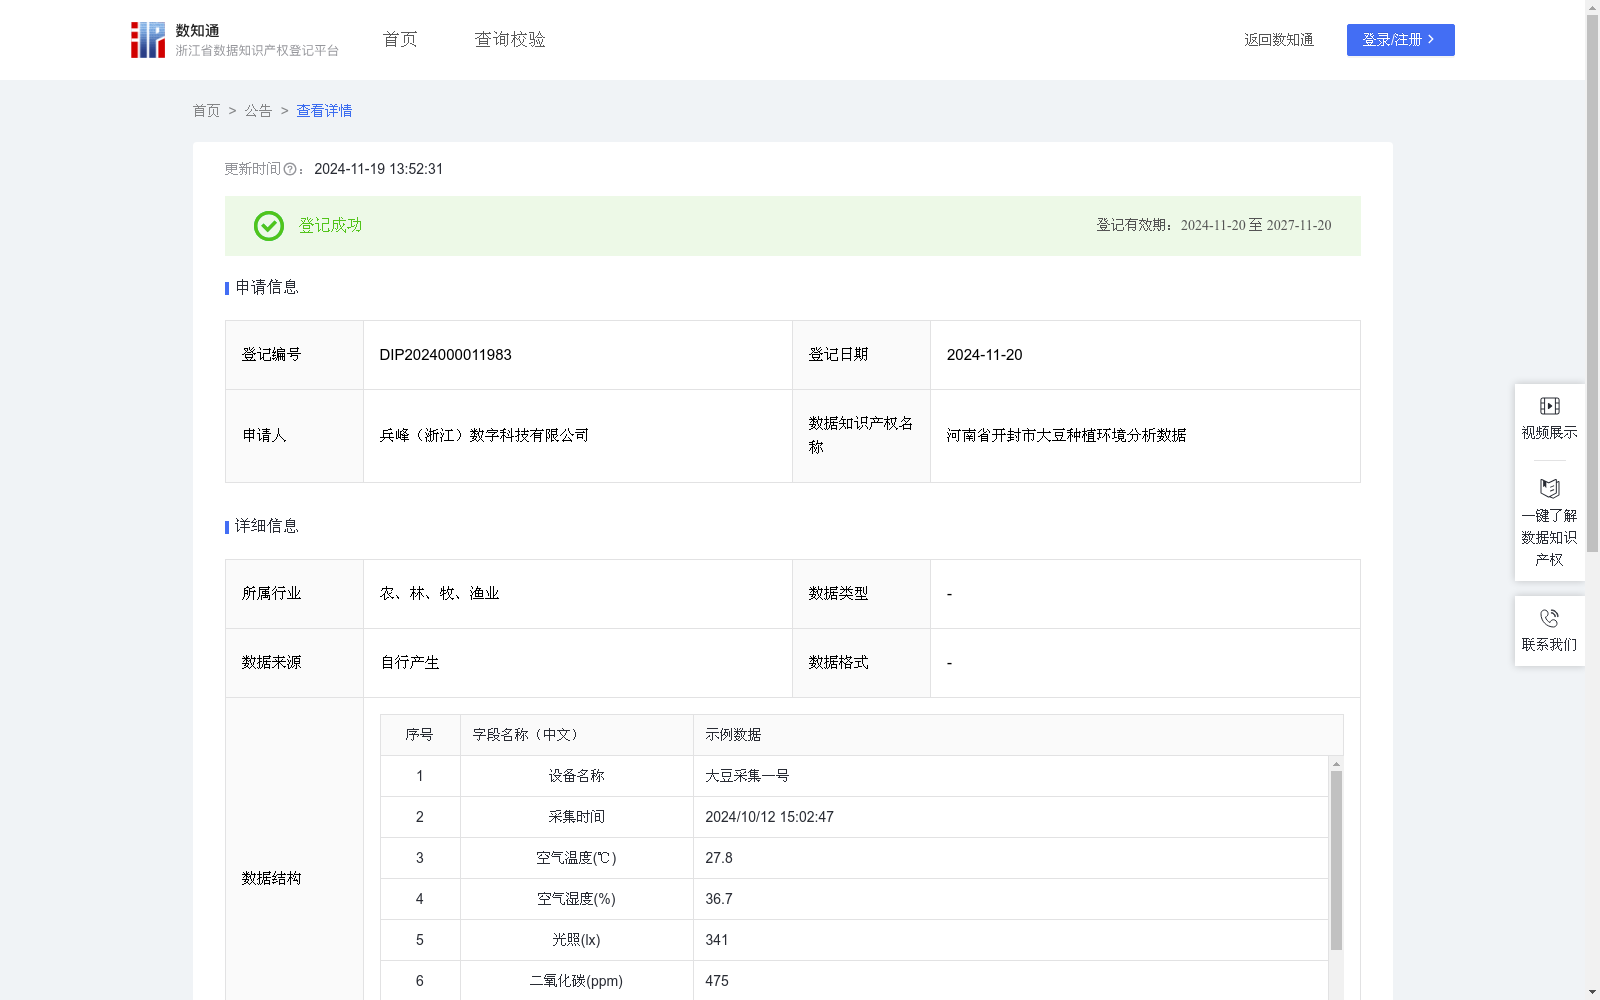
河南省开封市大豆种植环境分析数据
收藏浙江省数据知识产权登记平台2024-11-19 更新2024-11-20 收录
下载链接:
https://www.zjip.org.cn/home/announce/trends/86250
下载链接
链接失效反馈官方服务:
资源简介:
采集大豆种植的土壤湿温度、光照强度、二氧化碳浓度、空气温湿度等数据,全面评估不同环境条件对大豆生长的具体影响。如确定适宜的土壤温度和湿度区间,以利于大豆种子萌发和根系伸展。明确合适的光照强度和时长,推动大豆进行高效的光合作用,合成生长所需的有机物质。把握恰当的二氧化碳浓度,为大豆的生长发育提供充足的碳源,促进植株茁壮成长。同时,监测适宜的空气温湿度,为大豆营造舒适的生长大气环境。利用这些数据构建大豆品质与环境参数关联的深度网络模型,深入探索何种环境条件组合可以使大豆具有更高的蛋白质含量、更优的油脂品质和更好的抗逆性等,为显著提升大豆品质奠定基础。基于数据驱动的方式,为大豆种植环境的智能调控提供有效的支持,依据实时数据自动调整灌溉量、通风强度以及遮阳程度等,为大豆创造适宜的生长环境,提高种植效率和产量。将优化后的环境调控经验推广应用至不同地区的大豆种植中,形成多维度细粒度的感知与控制模式,有力推动大豆种植产业朝着科学、高效、模式可移植的方向发展,全面提升整个产业的竞争力。1.数据采集:本系统通过土壤湿温度传感器、光照传感器、空气温湿度传感器、智慧采集等物联网设备等物联网设备,结合4G/5G、Wi-Fi与有线网络,实时采集大豆种植环境中的土壤湿温度、光照强度、二氧化碳浓度、空气温湿度等多维数据。数据经过清洗和集成技术的处理,确保其准确性与一致性,为后续分析提供高质量的数据基础。2.算法规则:系统采用环境参数评分算法,对环境数据进行评分。评分基于大豆生长的理想条件(如温度、湿度、光照等),并通过以下公式计算:环境参数评分 = 100 - Σ ( w_i × |当前值_i - 理想值_i| / 容差_i )其中,Σ 表示对所有参数的累加,w_i 是第 i 个参数的权重。当前值_i 是第 i 个参数的实际测量值,理想值_i 是第 i 个参数的理想值。容差_i 是第 i 个参数的允许波动范围,偏离理想值越多,扣分越大。3.调控方案:系统根据分析结果将自动生成环境调控方案,针对多维度环境参数进行精细调整,确保环境条件始终维持在理想状态,从而提高作物的质量和产量。
This dataset collects multi-dimensional environmental data including soil moisture and temperature, light intensity, carbon dioxide concentration, and air temperature and humidity in soybean planting fields, aiming to comprehensively evaluate the specific impacts of different environmental conditions on soybean growth. Specifically, it aims to determine the optimal soil temperature and humidity ranges conducive to soybean seed germination and root elongation, define appropriate light intensity and duration to promote efficient photosynthesis in soybeans for synthesizing organic substances required for growth, regulate proper carbon dioxide concentration to provide sufficient carbon sources for soybean growth and development and promote robust plant growth, and monitor suitable air temperature and humidity to create a comfortable atmospheric environment for soybean growth. Using this data, a deep neural network model correlating soybean quality with environmental parameters is constructed to deeply explore which environmental condition combinations can endow soybeans with higher protein content, better oil quality, and stronger stress resistance, thereby laying a foundation for significantly improving soybean quality. Based on a data-driven approach, the dataset provides effective support for intelligent regulation of soybean planting environments: automatically adjusting irrigation volume, ventilation intensity, shading degree, etc., according to real-time data to create suitable growth environments for soybeans and improve planting efficiency and yield. The optimized environmental regulation experience will be promoted and applied to soybean planting in different regions, forming a multi-dimensional and fine-grained perception and control mode, effectively promoting the development of the soybean planting industry towards scientific, efficient, and mode-portable directions, and comprehensively enhancing the overall competitiveness of the industry.
1. Data Collection: This system collects real-time multi-dimensional environmental data from soybean planting fields through IoT devices such as soil moisture and temperature sensors, light sensors, air temperature and humidity sensors, and smart acquisition modules, combined with 4G/5G, Wi-Fi and wired networks. The collected data is processed via data cleaning and integration technologies to ensure accuracy and consistency, providing a high-quality data foundation for subsequent analysis.
2. Algorithm Rules: The system adopts an environmental parameter scoring algorithm to score the environmental data. The scoring is based on the ideal growth conditions of soybeans (e.g., temperature, humidity, light, etc.), and is calculated using the following formula:
Environmental Parameter Score = 100 - Σ ( w_i × |current value_i - ideal value_i| / tolerance_i )
Where Σ represents the summation over all parameters, w_i is the weight of the i-th parameter, current value_i is the actual measured value of the i-th parameter, ideal value_i is the ideal value of the i-th parameter, and tolerance_i is the allowable fluctuation range of the i-th parameter. The greater the deviation from the ideal value, the more points will be deducted.
3. Regulation Scheme: The system will automatically generate an environmental regulation scheme based on the analysis results, and finely adjust multi-dimensional environmental parameters to ensure that the environmental conditions are always maintained at the ideal state, thereby improving crop quality and yield.
提供机构:
兵峰(浙江)数字科技有限公司
创建时间:
2024-10-18
搜集汇总
数据集介绍
特点
河南省开封市大豆种植环境分析数据包含656条记录,每日更新,记录了土壤湿温度、光照强度、二氧化碳浓度、空气温湿度等多维数据,用于评估环境条件对大豆生长的影响和智能调控种植环境。
以上内容由遇见数据集搜集并总结生成


