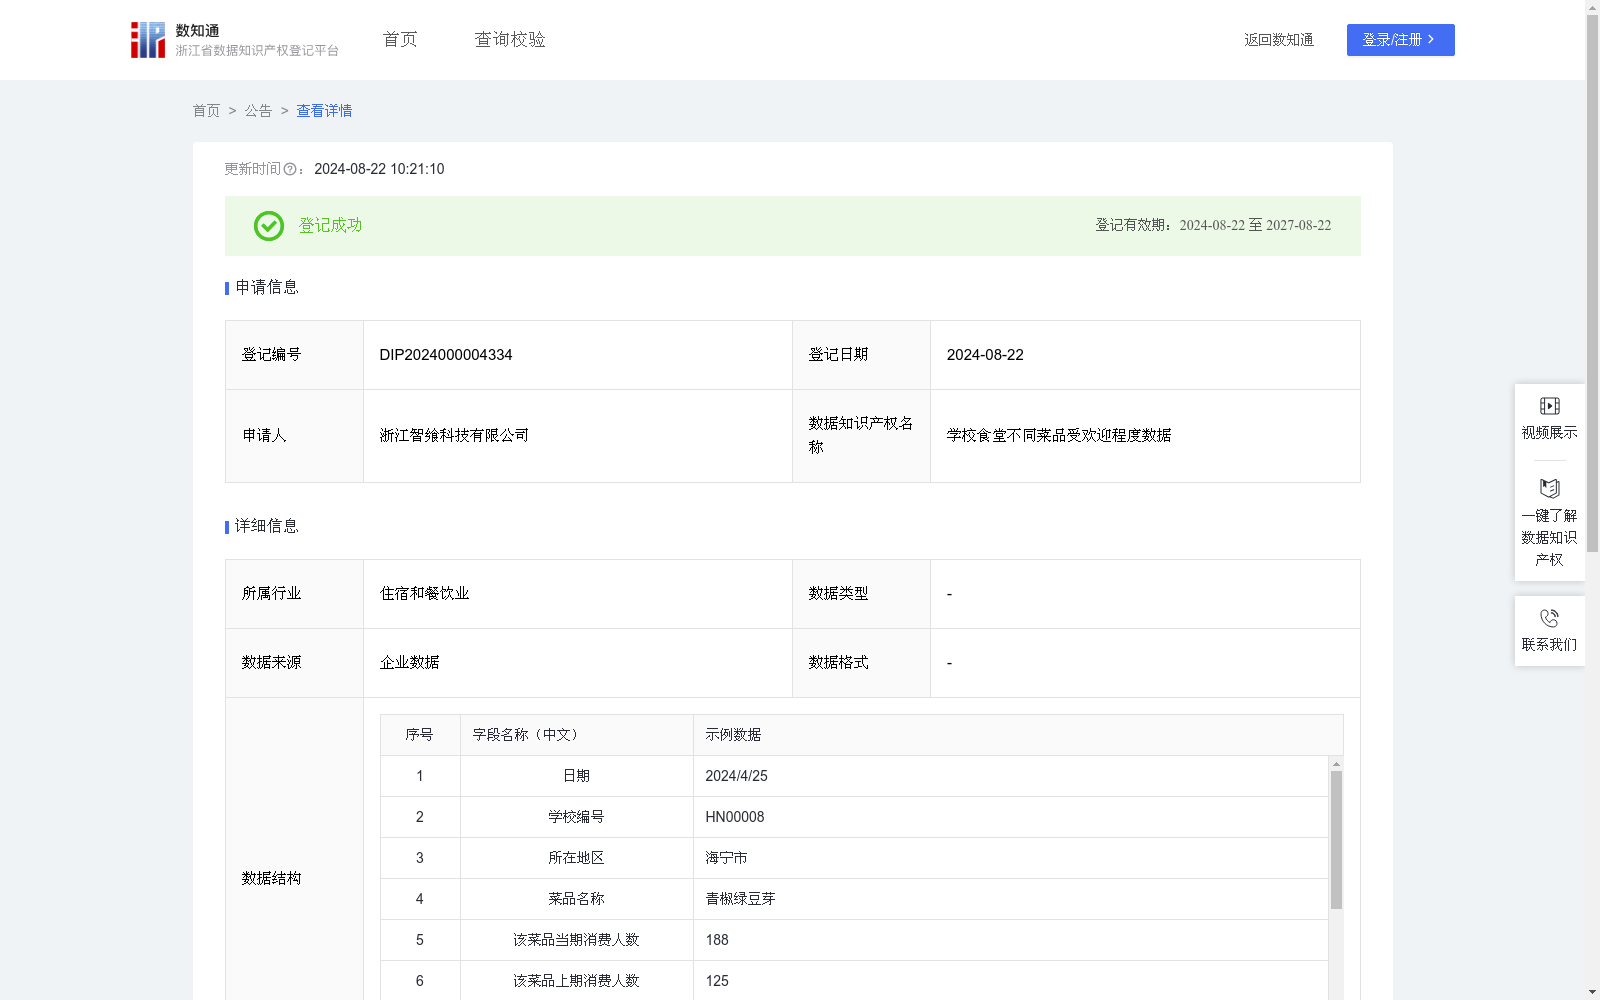
学校食堂不同菜品受欢迎程度数据
收藏浙江省数据知识产权登记平台2024-08-22 更新2024-08-23 收录
下载链接:
https://www.zjip.org.cn/home/announce/trends/53911
下载链接
链接失效反馈官方服务:
资源简介:
本数据能够客观反映学校食堂不同菜品的受欢迎程度。
1.根据受欢迎程度数据,食堂可以调整菜品供应,增加受欢迎菜品的供应量,减少不受欢迎菜品的供应量,使菜品设计更符合师生口味,提升师生的整体满意度,同时菜品的优化对于减少浪费、降低成本有较大帮助。2.本数据还可为行业内其他学校食堂单位的菜品设计提供参考,这些单位通过本数据可以了解本地区的菜品受欢迎程度情况,具有较大的参考价值。3.本数据还能为科研机构开展食品安全和营养学的相关研究提供实证支持。1.数据抽取和预处理:
(1)数据抽取:在自研的5G智慧食安工业物联网数字化管理平台数据库中抽取相关学校食堂的菜品消费数据,包括日期、学校编号、所在地区、菜品名称、该菜品当期消费人数、该菜品上期消费人数、食堂当期就餐总人数、食堂上期就餐总人数。(2)数据预处理:对抽取的数据进行清洗,去除重复、错误或无关的信息,以便后续的分析和建模。
2.基于菜品消费情况分析其受欢迎程度:
(1)计算该菜品当期和上期的消费率:当期消费率=当期消费人数÷食堂当期就餐总人数×100%;上期消费率=上期消费人数÷食堂上期就餐总人数×100%;(2)计算该菜品消费率较上期的变化:该菜品消费率较上期的变化=当期消费率-上期消费率;(3)建立菜品受欢迎程度评估模型:受欢迎指数=当期消费率×x+消费率较上期的变化×y;x和y为对应的系数,属于商业秘密,故不作详细列举;最后对菜品受欢迎程度进行判定:指数为80-100为非常受欢迎,60(含)-80为比较受欢迎,40(含)-60为一般受欢迎,20(含)-40为不太受欢迎,20以下为不受欢迎。
This dataset objectively reflects the popularity of different dishes in school canteens.
1. Based on the popularity data, canteens can adjust their dish supply: increase the supply of popular dishes and reduce that of unpopular ones, so as to better align dish offerings with teachers' and students' tastes, improve their overall satisfaction. Additionally, dish optimization greatly helps reduce food waste and lower operating costs.
2. This dataset can also provide references for dish design of other school canteen units in the same industry. These entities can learn about the local popularity of dishes through this dataset, which has considerable reference value.
3. This dataset can also offer empirical support for research institutions conducting relevant studies on food safety and nutrition.
### 1. Data Extraction and Preprocessing
(1) Data Extraction: Extract relevant dish consumption data of school canteens from the database of the self-developed 5G Smart Food Safety Industrial Internet of Things (IIoT) Digital Management Platform. The extracted data includes date, school ID, location, dish name, number of consumers of the dish in the current period, number of consumers of the dish in the previous period, total number of diners in the canteen in the current period, and total number of diners in the canteen in the previous period.
(2) Data Preprocessing: Clean the extracted data to remove duplicate, erroneous or irrelevant information, so as to facilitate subsequent analysis and modeling.
### 2. Analysis of Dish Popularity Based on Consumption Status
(1) Calculate the consumption rates of the dish in the current and previous periods:
Current period consumption rate = (Number of consumers of the dish in the current period ÷ Total number of diners in the canteen in the current period) × 100%;
Previous period consumption rate = (Number of consumers of the dish in the previous period ÷ Total number of diners in the canteen in the previous period) × 100%;
(2) Calculate the change in the dish's consumption rate compared to the previous period:
Change in consumption rate = Current period consumption rate - Previous period consumption rate;
(3) Establish a dish popularity evaluation model:
Popularity Index = Current period consumption rate × x + Change in consumption rate × y;
Where x and y are corresponding coefficients, which are trade secrets and will not be disclosed in detail. Finally, determine the popularity level of the dish:
- 80-100: Very popular
- 60 (inclusive) - 80: Relatively popular
- 40 (inclusive) - 60: Generally popular
- 20 (inclusive) - 40: Slightly unpopular
- Below 20: Unpopular
提供机构:
浙江智飨科技有限公司
创建时间:
2024-07-28
搜集汇总
数据集介绍
特点
该数据集包含1497条记录,每日更新,记录了学校食堂不同菜品的消费数据,包括消费人数、消费率、受欢迎指数等。数据可用于优化菜品供应、提升师生满意度,并为科研机构提供实证支持。
以上内容由遇见数据集搜集并总结生成


