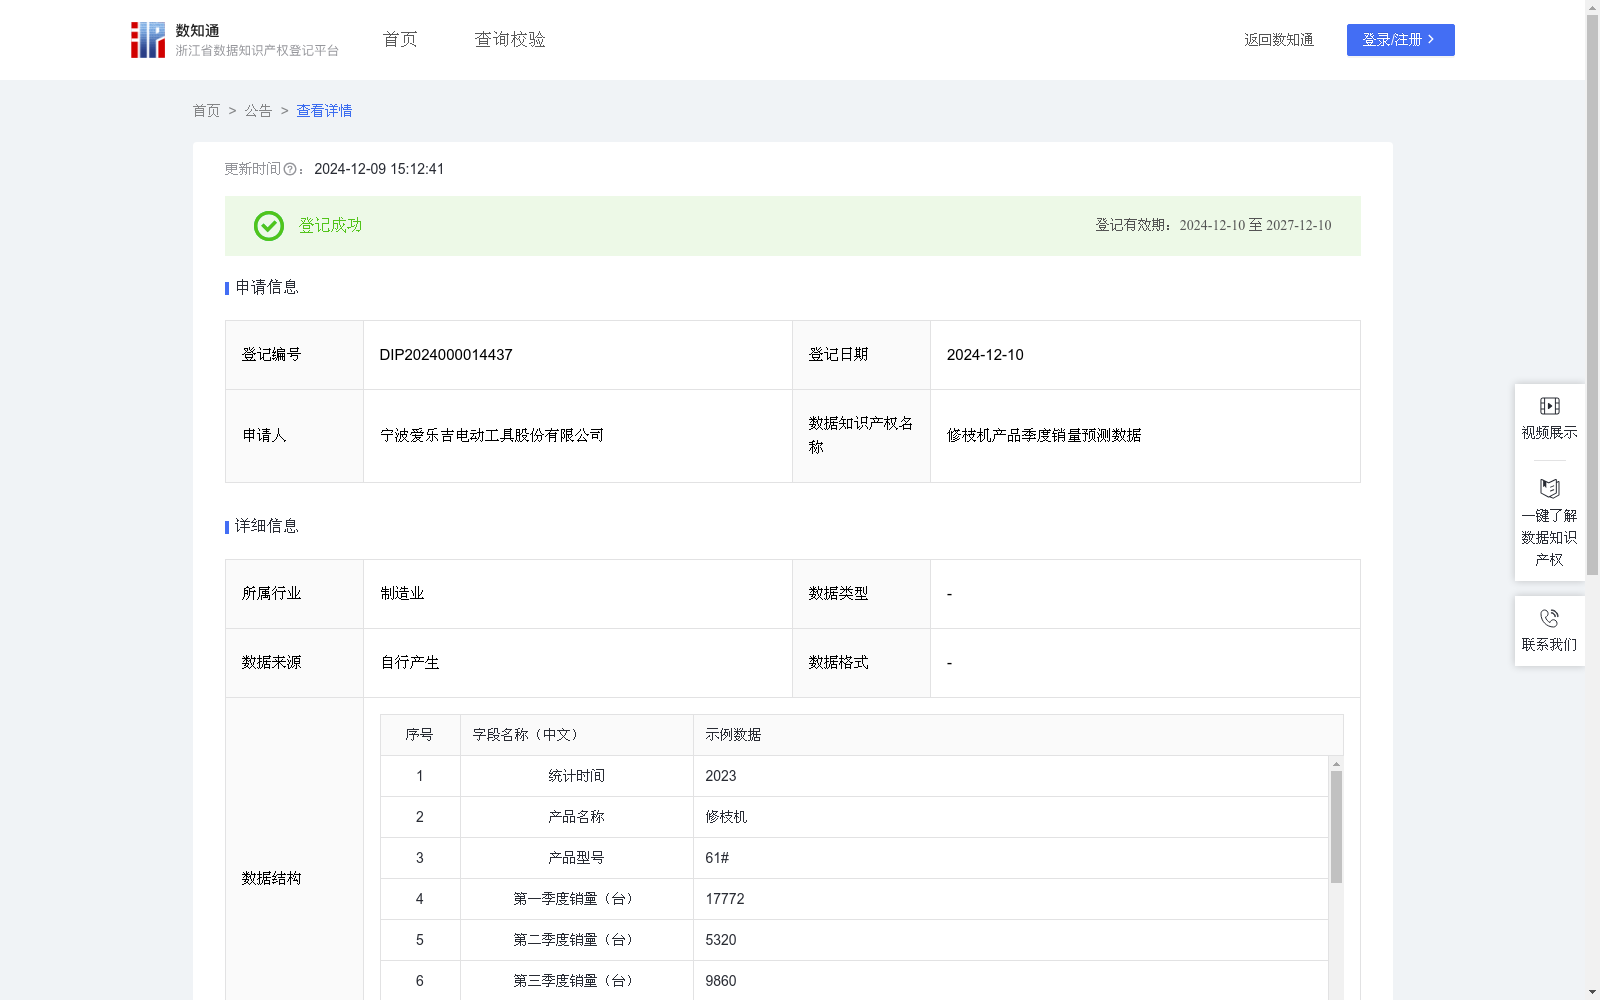
修枝机产品季度销量预测数据
收藏资源简介:
1.本公司可以根据预测的季度销量数据合理安排修枝机产品生产计划和调整库存水平;利用预测销量数据,可以更好地识别销售风险,如周期性波动可能导致的生产过剩或短缺。 2.本数据可以共享给本公司修枝机产品供应商和分销商,帮助其调整库存和物流计划,以更好、更快地适配市场需求。 3.本数据可供其他修枝机产品厂商、与修枝机产品相关的产业链上下游厂商、或类似电动工具的厂商参考了解产品的市场需求趋势,为研发、生产、市场营销等经营活动决策提供辅助依据。 4.本数据可为行业分析师分析修枝机产品市场趋势提供数据支持,为投资者和其他利益相关者提供洞察。 1.数据收集和预处理:(1)数据收集:收集公司内部销售管理平台对于不同规格修枝机产品的销售统计信息,包括统计时间、产品名称、产品型号、第一季度销量、第二季度销量、第三季度销量、第四季度销量、全年总销量。(2)数据预处理:对采集到的原始数据进行处理,去除缺失和异常数据。 2.计算全年季度平均销量:全年季度平均销量=全年总销量/4 3.计算季度性销售指数:季度性销售指数 = (该季度总销量 / 全年季度平均销量)× 100%,季度性销售指数大于100%表示该季度销售量高于平均,小于100%表示低于平均。 4.使用ARIMA(自回归积分滑动平均)模型(一种用于分析按时间顺序排列的数据点,以识别趋势、周期性和其他模式的统计模型)进行时间序列分析,基于历史季度销量数据,并利用季节性销售指数作为调整因子来提高预测准确定,来预测未来特定季度的产品销量。
1. Our company can reasonably arrange the production plan and adjust the inventory level of hedge trimmers based on the predicted quarterly sales data. By leveraging the forecasted sales figures, we can better identify sales risks, such as overproduction or shortages caused by cyclical market fluctuations. 2. This dataset can be shared with the company's hedge trimmer suppliers and distributors, to assist them in adjusting their inventory and logistics plans, so as to better and more rapidly adapt to market demand. 3. This dataset can also serve as a reference for other hedge trimmer manufacturers, upstream and downstream enterprises in the hedge trimmer industry chain, or manufacturers of similar power tools, to help them understand market demand trends of related products, and provide auxiliary support for decision-making in business activities including R&D, production and marketing. 4. This dataset can provide data support for industry analysts when conducting market trend analyses of hedge trimmers, and offer actionable insights for investors and other relevant stakeholders. 1. Data Collection and Preprocessing: (1) Data Collection: Collect sales statistics of hedge trimmers of various specifications from the company's internal sales management platform, including statistical time, product name, product model, first-quarter sales, second-quarter sales, third-quarter sales, fourth-quarter sales, and annual total sales. (2) Data Preprocessing: Process the collected raw data by eliminating missing and abnormal data entries. 2. Calculate the Annual Average Quarterly Sales: Annual Average Quarterly Sales = Annual Total Sales / 4 3. Calculate the Seasonal Sales Index: Seasonal Sales Index = (Total Quarterly Sales / Annual Average Quarterly Sales) × 100%. A seasonal sales index greater than 100% indicates that the quarterly sales volume is higher than the average level, while an index less than 100% indicates that the quarterly sales volume is lower than the average level. 4. Use the ARIMA (AutoRegressive Integrated Moving Average, a statistical model designed to analyze sequentially ordered data points to identify trends, cyclical patterns and other inherent data patterns) model for time series analysis. Based on historical quarterly sales data and using the seasonal sales index as an adjustment factor to enhance prediction accuracy, we can forecast the product sales volume in specific future quarters.