中国长序列地表冻融数据集——双指标算法(1978-2015)
收藏资源简介:
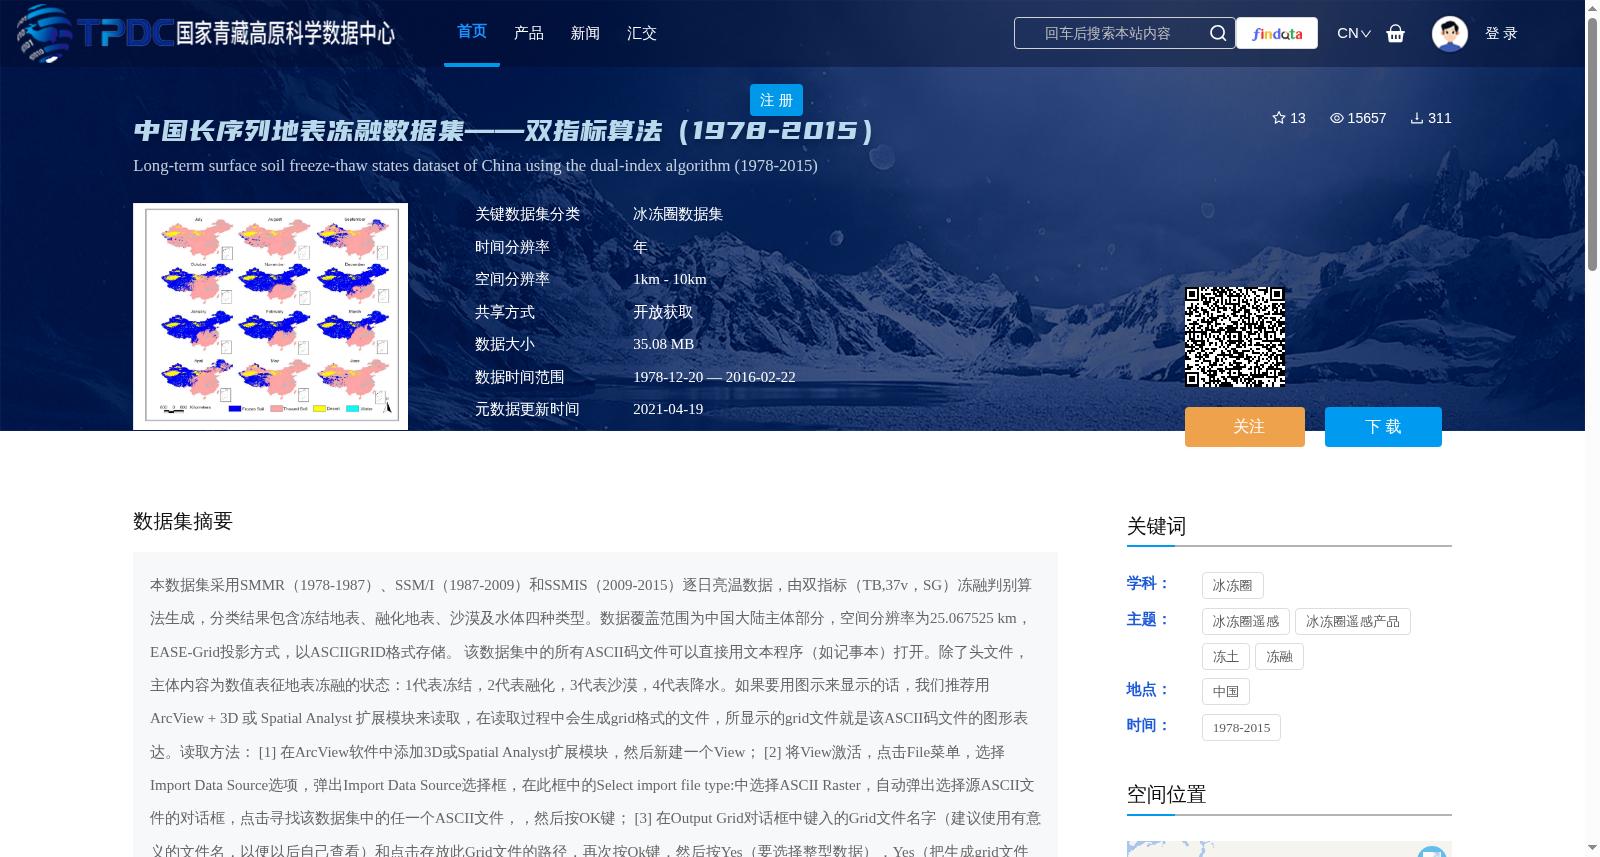
本数据集采用SMMR(1978-1987)、SSM/I(1987-2009)和SSMIS(2009-2015)逐日亮温数据,由双指标(TB,37v,SG)冻融判别算法生成,分类结果包含冻结地表、融化地表、沙漠及水体四种类型。数据覆盖范围为中国大陆主体部分,空间分辨率为25.067525 km,EASE-Grid投影方式,以ASCIIGRID格式存储。 该数据集中的所有ASCII码文件可以直接用文本程序(如记事本)打开。除了头文件,主体内容为数值表征地表冻融的状态:1代表冻结,2代表融化,3代表沙漠,4代表降水。如果要用图示来显示的话,我们推荐用ArcView + 3D 或 Spatial Analyst 扩展模块来读取,在读取过程中会生成grid格式的文件,所显示的grid文件就是该ASCII码文件的图形表达。读取方法: [1] 在ArcView软件中添加3D或Spatial Analyst扩展模块,然后新建一个View; [2] 将View激活,点击File菜单,选择Import Data Source选项,弹出Import Data Source选择框,在此框中的Select import file type:中选择ASCII Raster,自动弹出选择源ASCII文件的对话框,点击寻找该数据集中的任一个ASCII文件,,然后按OK键; [3] 在Output Grid对话框中键入的Grid文件名字(建议使用有意义的文件名,以便以后自己查看)和点击存放此Grid文件的路径,再次按Ok键,然后按Yes(要选择整型数据),Yes(把生成grid文件调入到当前的view中)。生成的文件可以按照Grid文件标准进行属性编辑。这样就完成了显示将ASCII文件显示成Grid文件的过程。 [4] 批处理时,可以使用ARCINFO的ASCIIGRID命令,编写成AML文件,再用Run命令在Grid模块中完成: Usage: ASCIIGRID <in_ascii_file> <out_grid> {INT | FLOAT} 本数据的生产得到自然科学基金项目:中国西部环境与生态科学数据中心(90502010)、中国西部地区陆面数据同化系统研究(90202014)以及冻土主被动微波辐射传输模拟及其辐射散射特性研究(41071226)的支持。
This dataset utilizes daily brightness temperature data from SMMR (1978–1987), SSM/I (1987–2009), and SSMIS (2009–2015), which was generated using a two-index (TB, 37v, SG) freeze-thaw discrimination algorithm. The classification results include four categories: frozen land surface, thawed land surface, desert, and water body. The dataset covers mainland China, with a spatial resolution of 25.067525 km, adopting EASE-Grid projection and stored in ASCIIGRID format. All ASCII files in this dataset can be directly opened with text editors such as Notepad. Excluding the header file, the main content comprises numerical values representing surface freeze-thaw status: 1 denotes frozen, 2 denotes thawed, 3 denotes desert, and 4 denotes precipitation. For visualization purposes, we recommend using ArcView with the 3D or Spatial Analyst extension modules to process the data. During the reading process, grid-format files will be generated, which serve as the graphical representations of the original ASCII files. The detailed reading steps are as follows: [1] Add the 3D or Spatial Analyst extension modules in ArcView, then create a new View; [2] Activate the View, click the File menu, select the Import Data Source option, and the Import Data Source dialog box will appear. In the Select import file type dropdown menu, choose ASCII Raster, which will automatically open a file selection dialog for the source ASCII file. Locate any ASCII file in this dataset and click OK; [3] Enter a name for the output Grid file (it is recommended to use a descriptive filename for future reference) and specify the storage path in the Output Grid dialog box, then press OK. Subsequently, click Yes to select integer data, and click Yes again to load the generated Grid file into the current View. The generated files can be edited for attributes in accordance with Grid file standards, completing the process of converting an ASCII file into a visual Grid file. [4] For batch processing, you can use the ASCIIGRID command of ARCINFO by writing an AML script file, then execute it via the Run command in the Grid module: Usage: ASCIIGRID <in_ascii_file> <out_grid> {INT | FLOAT} This dataset was developed with support from the National Natural Science Foundation of China projects: Data Center for West China Environmental and Ecological Sciences (90502010), Research on Land Data Assimilation System for Western China (90202014), and Study on Active and Passive Microwave Radiative Transfer Simulation of Frozen Soil and Its Radiation Scattering Characteristics (41071226).