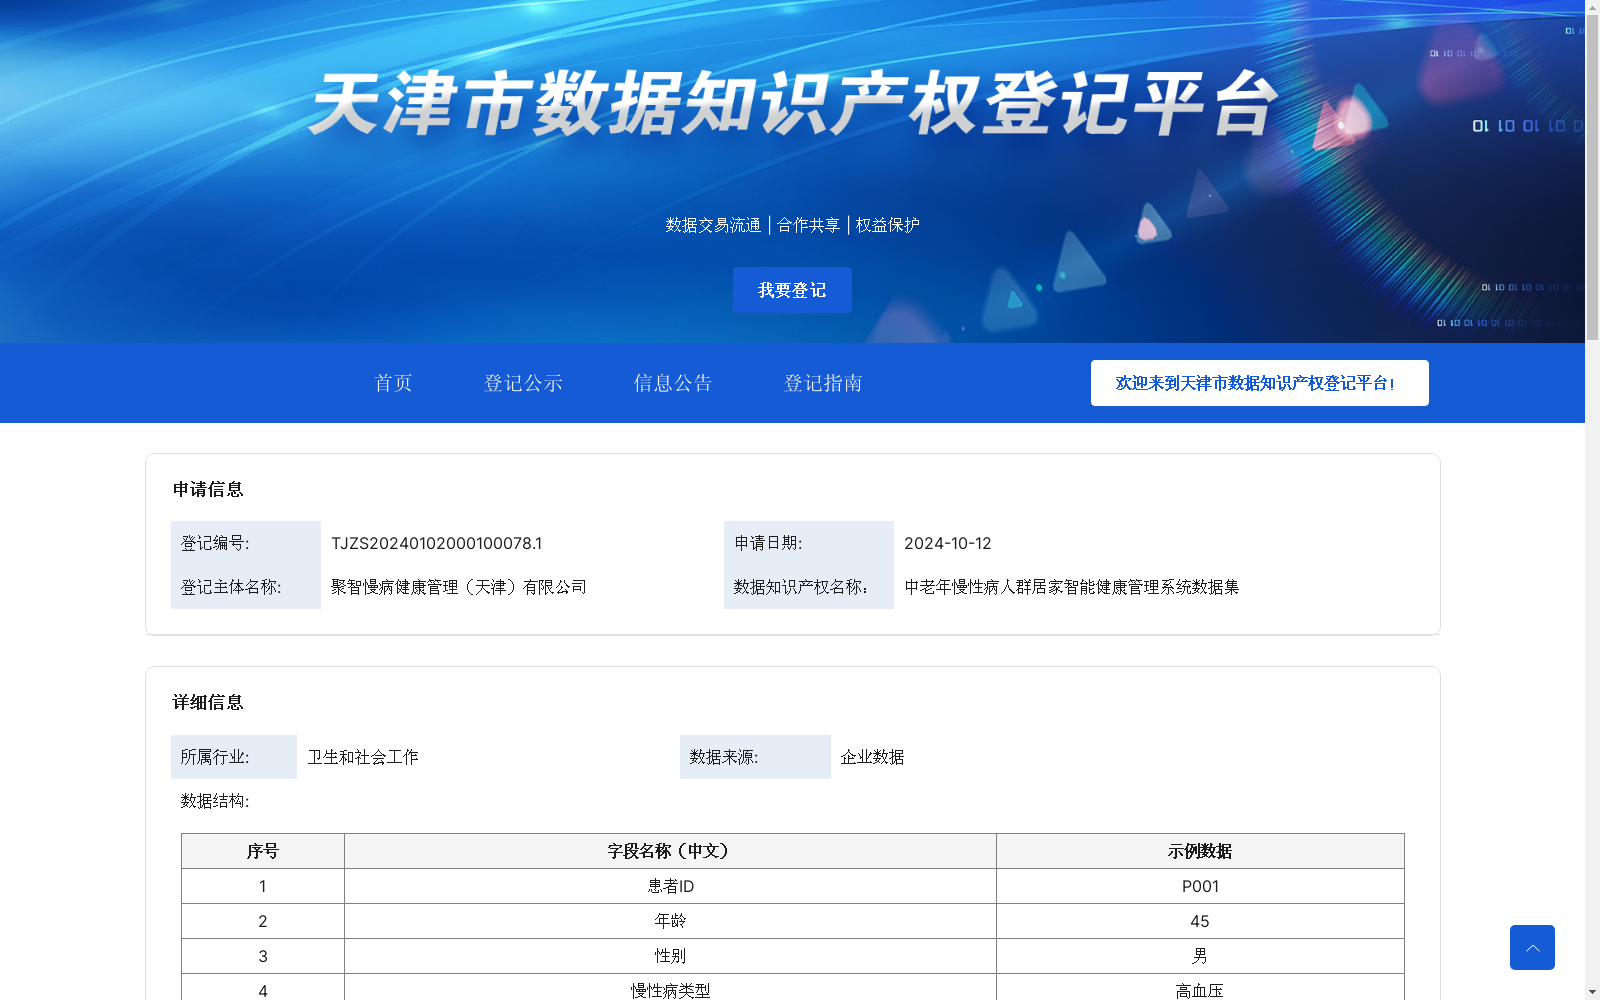
中老年慢性病人群居家智能健康管理系统数据集
收藏天津市数据知识产权登记平台2024-10-12 更新2024-10-25 收录
下载链接:
https://dengji.tjippc.cn/xxgg_nr?id=ebf500e8-e675-4fd6-ba25-d6cfb7c2a67b
下载链接
链接失效反馈官方服务:
资源简介:
1. 数据采集与预处理算法
1.1 数据采集整合:
系统通过家庭智能设备采集患者的生理数据、行为数据、环境数据。系统将各类数据整合到统一的数据集中。
规则:
设备数据通过API接口定期自动上传到云平台。
每个患者的所有数据点都与其唯一的患者ID关联。
数据采集频率由设备类型和患者病情决定,血压、血糖数据采集频率为每日一次,运动数据每小时采集一次。
1.2 数据清洗:
由于设备可能会产生噪声或异常数据,系统对数据进行预处理,包括缺失值填补、异常值处理。
算法:
1.2.1缺失值处理:使用线性插值法填补时间序列中的小规模缺失数据;对于大规模缺失,则标记为不可用数据。
1.2.2异常值处理:运用3a原则进行检测,或基于历史数据的上下限范围设定合理的阈值。异常值可通过历史均值替换或删除。
1.2.3噪声过滤:对心率、血压等时间序列数据,使用移动平均滤波器平滑数据,减少采集误差。
2. 健康状态评估算法
2.1 血压状态评估:
根据患者的收缩压和舒张压数据,评估其血压状态。
算法:
根据临床医学标准,定义血压状态:
正常:收缩压 小于 120 mmHg 且 舒张压小于 80 mmHg
正常偏高:收缩压 120-139 mmHg 或 舒张压 80-89 mmHg
高血压 I 级:收缩压 140-159 mmHg 或 舒张压 90-99 mmHg
高血压 II 级:收缩压大于等于 160 mmHg 或 舒张压 大于等于 100 mmHg
算法通过条件判断对每次测量的血压数据进行分类,并记录每周或每月的血压波动趋势。
2.2 血糖控制水平评估:
根据患者的空腹血糖和餐后血糖数据,评估其糖尿病控制水平。
算法:
根据糖尿病管理标准,定义血糖控制水平:
正常:空腹血糖 3.9-6.1 mmol/L,餐后血糖 小于 7.8 mmol/L
控制良好:空腹血糖 6.1-7.0 mmol/L,餐后血糖 7.8-10 mmol/L
控制不佳:空腹血糖 大于7.0 mmol/L,餐后血糖 大于10 mmol/L
通过计算一段时间内的平均血糖值,使用加权平均算法结合空腹和餐后血糖,判断患者的血糖控制情况。
2.3 体重评估:
根据患者的体重和BMI,评估体重是否在健康范围内。
算法:
BMI计算公式:BMI 等于 体重/ 身高²
正常体重:BMI 18.5-24.9
超重:BMI大于等于 25
肥胖:BMI 大于等于30
系统根据患者每次体重数据自动计算BMI,评估体重变化趋势,给出体重管理的建议。
3. 个性化健康管理建议生成算法
3.1 运动建议生成:
根据患者的运动数据,结合其慢性病类型,生成适当的运动建议。
算法:
根据世界卫生组织推荐的运动标准,建议每周至少进行150分钟的中等强度运动。
系统根据患者的日均步数、运动频率,计算其运动量是否达标。
如果患者运动量不足,系统生成例如每日步行7000步,适量慢跑等建议,若患者患有心血管疾病,则建议较为温和的运动方式。
使用规则引擎定义运动建议的生成逻辑,例如:
若日均步数 小于5000,生成建议增加每日步数至7000。
若运动天数 小于3天/周,生成建议每周至少运动3天。
3.2 饮食建议生成:
根据患者的生理数据,结合其慢性病类型,生成个性化饮食建议。
算法:
结合患者的高血压、糖尿病状态,使用分类算法确定饮食优先级:
高血压患者:建议低盐饮食,减少钠摄入。
糖尿病患者:建议低糖饮食,控制碳水化合物摄入。
通过关联规则算法分析相似病患的饮食数据,生成个性化饮食方案。
系统会自动根据患者的健康状态波动,调整饮食建议。例如:
若血糖控制不佳,建议减少精制糖摄入,多吃富含纤维的食物。
若体重超标,则建议减少高热量食物的摄入,增加蔬菜水果摄入。
4. 健康风险预测算法
4.1 高血压风险预测:
基于患者的血压数据、遗传因素、行为数据等,预测其未来高血压风险等级。
算法:
使用逻辑回归算法,结合以下特征进行高血压风险预测:
年龄
既往血压数据
日常运动量
饮食习惯
遗传因素
通过训练模型,输出高血压风险等级,并在风险较高时给出预警。
4.2 糖尿病并发症风险预测:
基于患者的血糖控制情况、体重、饮食和运动数据,评估糖尿病并发症的风险。
算法:
使用随机森林算法,结合以下特征进行并发症风险预测:
血糖水平
BMI指数
日常运动情况
饮食控制情况
既往病史
随机森林通过决策树的组合,输出糖尿病并发症的风险等级,并在高风险时发送实时提醒。
5. 健康风险预警算法
5.1 动态趋势分析与预警:
描述:通过分析患者健康数据的变化趋势,检测异常波动并发出预警。
算法:
使用时间序列分析对生理数据进行趋势预测。
若系统检测到生理数据超出正常范围或出现显著波动,则发出健康预警。
系统会结合历史数据,生成短期趋势预测,并在预测到风险时提前预警。
1. Data Collection and Preprocessing Algorithms
1.1 Data Collection and Integration:
Systems collect physiological, behavioral, and environmental data of patients via smart home devices, and integrate all types of data into a unified dataset.
Rules:
Device data is automatically uploaded to the cloud platform at regular intervals via API interfaces.
All data points of each patient are associated with their unique patient ID.
The data collection frequency is determined by the device type and the patient's condition: blood pressure and blood glucose data are collected once daily, while exercise data is collected once per hour.
1.2 Data Cleaning:
Since devices may generate noisy or abnormal data, the system performs preprocessing including missing value imputation and outlier handling.
Algorithms:
1.2.1 Missing Value Handling: Linear interpolation is used to fill small-scale missing data in time series; for large-scale missing data, they are marked as unavailable.
1.2.2 Outlier Handling: The three-sigma rule is applied for detection, or reasonable thresholds are set based on the upper and lower limits of historical data. Outliers can be replaced by the historical mean or deleted.
1.2.3 Noise Filtering: For time series data such as heart rate and blood pressure, a moving average filter is used to smooth the data and reduce collection errors.
2. Health Status Assessment Algorithms
2.1 Blood Pressure Status Assessment:
Evaluate the patient's blood pressure status based on their systolic and diastolic blood pressure data.
Algorithm:
Define blood pressure status according to clinical medical standards:
Normal: Systolic blood pressure < 120 mmHg AND diastolic blood pressure < 80 mmHg
Elevated Blood Pressure: Systolic blood pressure 120–139 mmHg OR diastolic blood pressure 80–89 mmHg
Hypertension Stage 1: Systolic blood pressure 140–159 mmHg OR diastolic blood pressure 90–99 mmHg
Hypertension Stage 2: Systolic blood pressure ≥ 160 mmHg OR diastolic blood pressure ≥ 100 mmHg
The algorithm classifies each measured blood pressure data through conditional judgment, and records the weekly or monthly blood pressure fluctuation trend.
2.2 Glycemic Control Level Assessment:
Evaluate the patient's diabetes control level based on their fasting blood glucose and postprandial blood glucose data.
Algorithm:
Define glycemic control levels according to diabetes management standards:
Normal: Fasting blood glucose 3.9–6.1 mmol/L, postprandial blood glucose < 7.8 mmol/L
Well-controlled: Fasting blood glucose 6.1–7.0 mmol/L, postprandial blood glucose 7.8–10 mmol/L
Poorly controlled: Fasting blood glucose >7.0 mmol/L, postprandial blood glucose >10 mmol/L
The system calculates the average blood glucose over a period of time, uses a weighted average algorithm combining fasting and postprandial blood glucose to determine the patient's glycemic control status.
2.3 Weight Assessment:
Assess whether the patient's weight is within the healthy range based on their weight and BMI.
Algorithm:
BMI calculation formula: BMI = weight / (height)²
Normal Weight: BMI 18.5–24.9
Overweight: BMI ≥25
Obesity: BMI ≥30
The system automatically calculates BMI based on each of the patient's weight data, evaluates the weight change trend, and provides weight management recommendations.
3. Personalized Health Management Recommendation Generation Algorithms
3.1 Exercise Recommendation Generation:
Generate appropriate exercise recommendations based on the patient's exercise data combined with their chronic disease type.
Algorithm:
According to the exercise guidelines recommended by the World Health Organization (WHO), it is recommended to perform at least 150 minutes of moderate-intensity exercise per week.
The system calculates whether the patient's exercise volume meets the standard based on their average daily steps and exercise frequency.
If the patient's exercise volume is insufficient, the system generates recommendations such as walking 7000 steps per day and appropriate jogging. For patients with cardiovascular diseases, milder exercise methods are recommended.
A rule engine is used to define the generation logic of exercise recommendations, for example:
If average daily steps <5000, generate a recommendation to increase daily steps to 7000.
If the number of exercise days <3 days/week, generate a recommendation to exercise at least 3 days per week.
3.2 Diet Recommendation Generation:
Generate personalized diet recommendations based on the patient's physiological data combined with their chronic disease type.
Algorithm:
Combine the patient's hypertension and diabetes status, use classification algorithms to determine dietary priorities:
Hypertensive patients: Recommended low-salt diet to reduce sodium intake.
Diabetic patients: Recommended low-sugar diet to control carbohydrate intake.
Analyze the dietary data of similar patients using association rule algorithms to generate personalized diet plans.
The system automatically adjusts diet recommendations based on fluctuations in the patient's health status. For example:
If glycemic control is poor, recommend reducing refined sugar intake and eating more fiber-rich foods.
If overweight, recommend reducing high-calorie food intake and increasing intake of fruits and vegetables.
4. Health Risk Prediction Algorithms
4.1 Hypertension Risk Prediction:
Predict the patient's future hypertension risk level based on their blood pressure data, genetic factors, behavioral data, etc.
Algorithm:
Use logistic regression algorithm combined with the following features for hypertension risk prediction:
Age
Past blood pressure data
Daily exercise volume
Dietary habits
Genetic factors
The trained model outputs the hypertension risk level, and issues an early warning when the risk is high.
4.2 Diabetes Complication Risk Prediction:
Evaluate the risk of diabetes complications based on the patient's glycemic control, weight, diet and exercise data.
Algorithm:
Use random forest algorithm combined with the following features for complication risk prediction:
Blood glucose level
BMI index
Daily exercise status
Dietary control status
Past medical history
The random forest, through a combination of decision trees, outputs the risk level of diabetes complications, and sends real-time reminders when the risk is high.
5. Health Risk Early Warning Algorithms
5.1 Dynamic Trend Analysis and Early Warning:
Description: Detect abnormal fluctuations and issue early warnings by analyzing the changing trends of the patient's health data.
Algorithm:
Use time series analysis to perform trend prediction on physiological data.
If the system detects that physiological data exceeds the normal range or has significant fluctuations, a health warning is issued.
The system combines historical data to generate short-term trend predictions, and provides early warnings when risks are predicted.
提供机构:
聚智慢病健康管理(天津)有限公司
创建时间:
2024-10-12
搜集汇总
数据集介绍
以上内容由遇见数据集搜集并总结生成


