青海省各监测区地下水水位动态变化统计(2015-2018)
收藏国家青藏高原科学数据中心2022-04-18 更新2024-03-01 收录
下载链接:
https://data.tpdc.ac.cn/zh-hans/data/2e1354b4-fe91-457b-8395-64b3f502e427
下载链接
链接失效反馈官方服务:
资源简介:
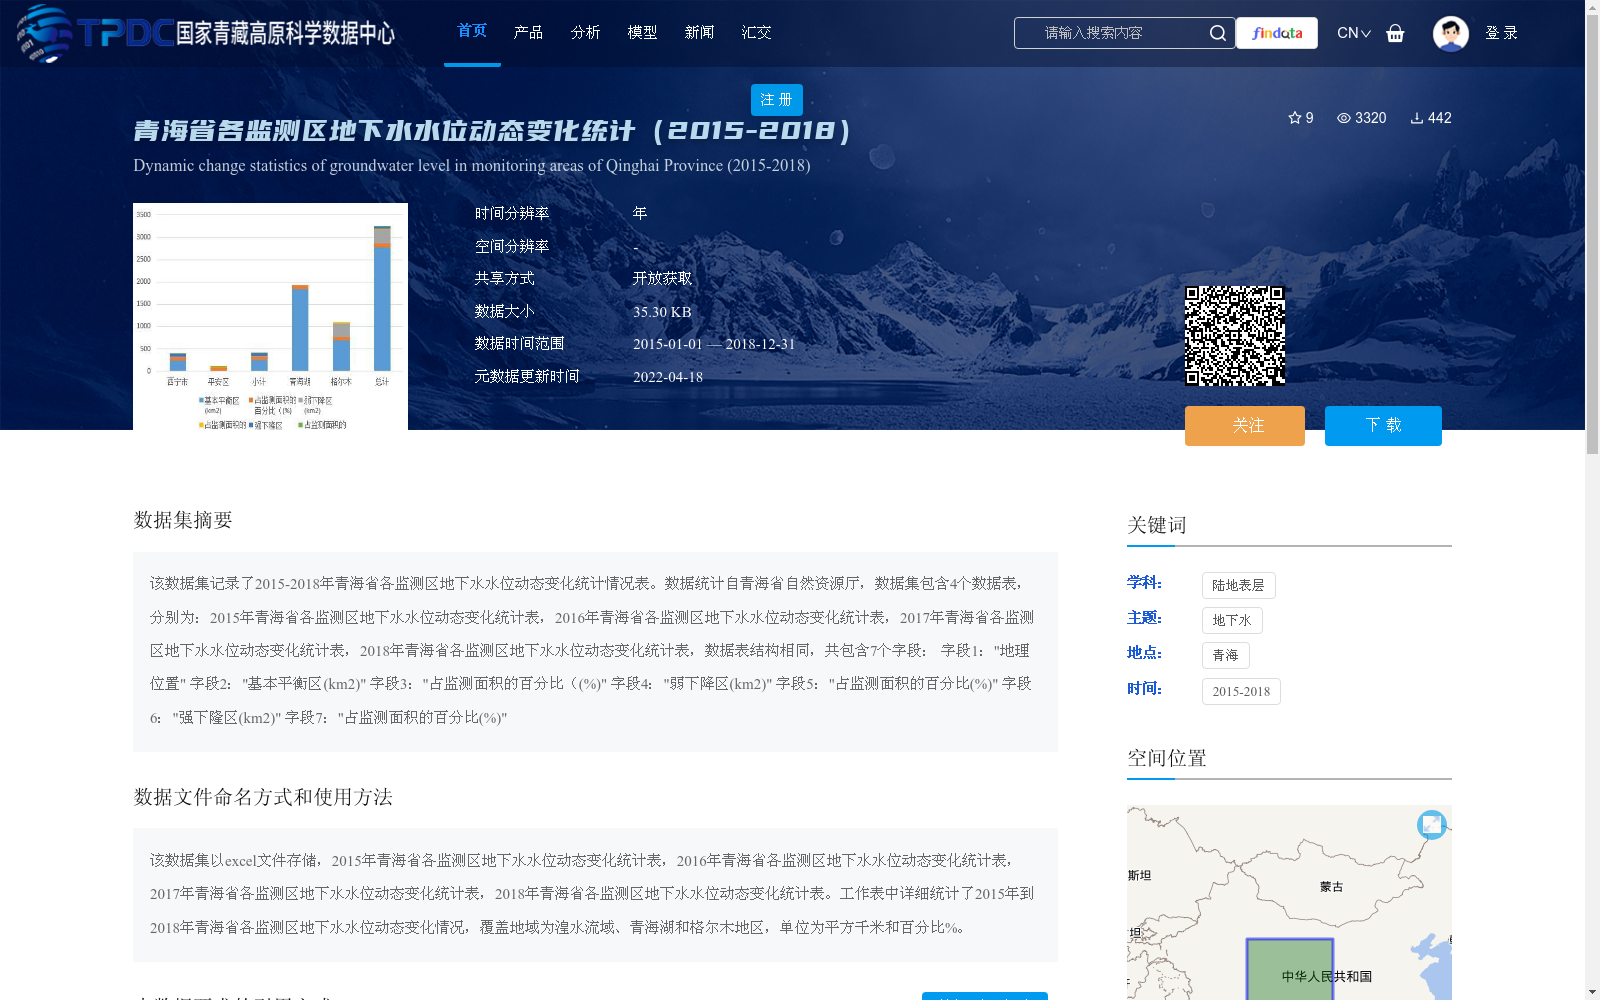
该数据集记录了2015-2018年青海省各监测区地下水水位动态变化统计情况表。数据统计自青海省自然资源厅,数据集包含4个数据表,分别为:2015年青海省各监测区地下水水位动态变化统计表,2016年青海省各监测区地下水水位动态变化统计表,2017年青海省各监测区地下水水位动态变化统计表,2018年青海省各监测区地下水水位动态变化统计表,数据表结构相同,共包含7个字段:
字段1:"地理位置"
字段2:"基本平衡区(km2)"
字段3:"占监测面积的百分比((%)"
字段4:"弱下降区(km2)"
字段5:"占监测面积的百分比(%)"
字段6:"强下隆区(km2)"
字段7:"占监测面积的百分比(%)"
This dataset documents the statistical tables of dynamic changes in groundwater levels across all monitoring areas in Qinghai Province from 2015 to 2018. The data is sourced from the Department of Natural Resources of Qinghai Province. The dataset comprises four data tables, specifically:
1. Statistical Table of Dynamic Changes in Groundwater Levels in Each Monitoring Area of Qinghai Province, 2015
2. Statistical Table of Dynamic Changes in Groundwater Levels in Each Monitoring Area of Qinghai Province, 2016
3. Statistical Table of Dynamic Changes in Groundwater Levels in Each Monitoring Area of Qinghai Province, 2017
4. Statistical Table of Dynamic Changes in Groundwater Levels in Each Monitoring Area of Qinghai Province, 2018
All four data tables share identical structures, containing a total of 7 fields as follows:
1. "Geographical Location"
2. "Basic Balance Area (km²)"
3. "Percentage of the Monitored Area (%)"
4. "Weak Decline Area (km²)"
5. "Percentage of the Monitored Area (%)"
6. "Strong Decline Area (km²)"
7. "Percentage of the Monitored Area (%)"
提供机构:
青海省自然资源厅
创建时间:
2021-01-05
搜集汇总
数据集介绍
背景与挑战
背景概述
该数据集记录了2015年至2018年青海省各监测区地下水水位的动态变化统计情况,包含湟水流域、青海湖和格尔木地区的年度数据表,每个表涵盖地理位置、基本平衡区、弱下降区和强下降区的面积及百分比信息。数据集以Excel格式存储,数据量较小(35.30 KB),时间分辨率为年,共享方式为开放获取,适用于研究青海省地下水资源的时空变化趋势。
以上内容由遇见数据集搜集并总结生成


