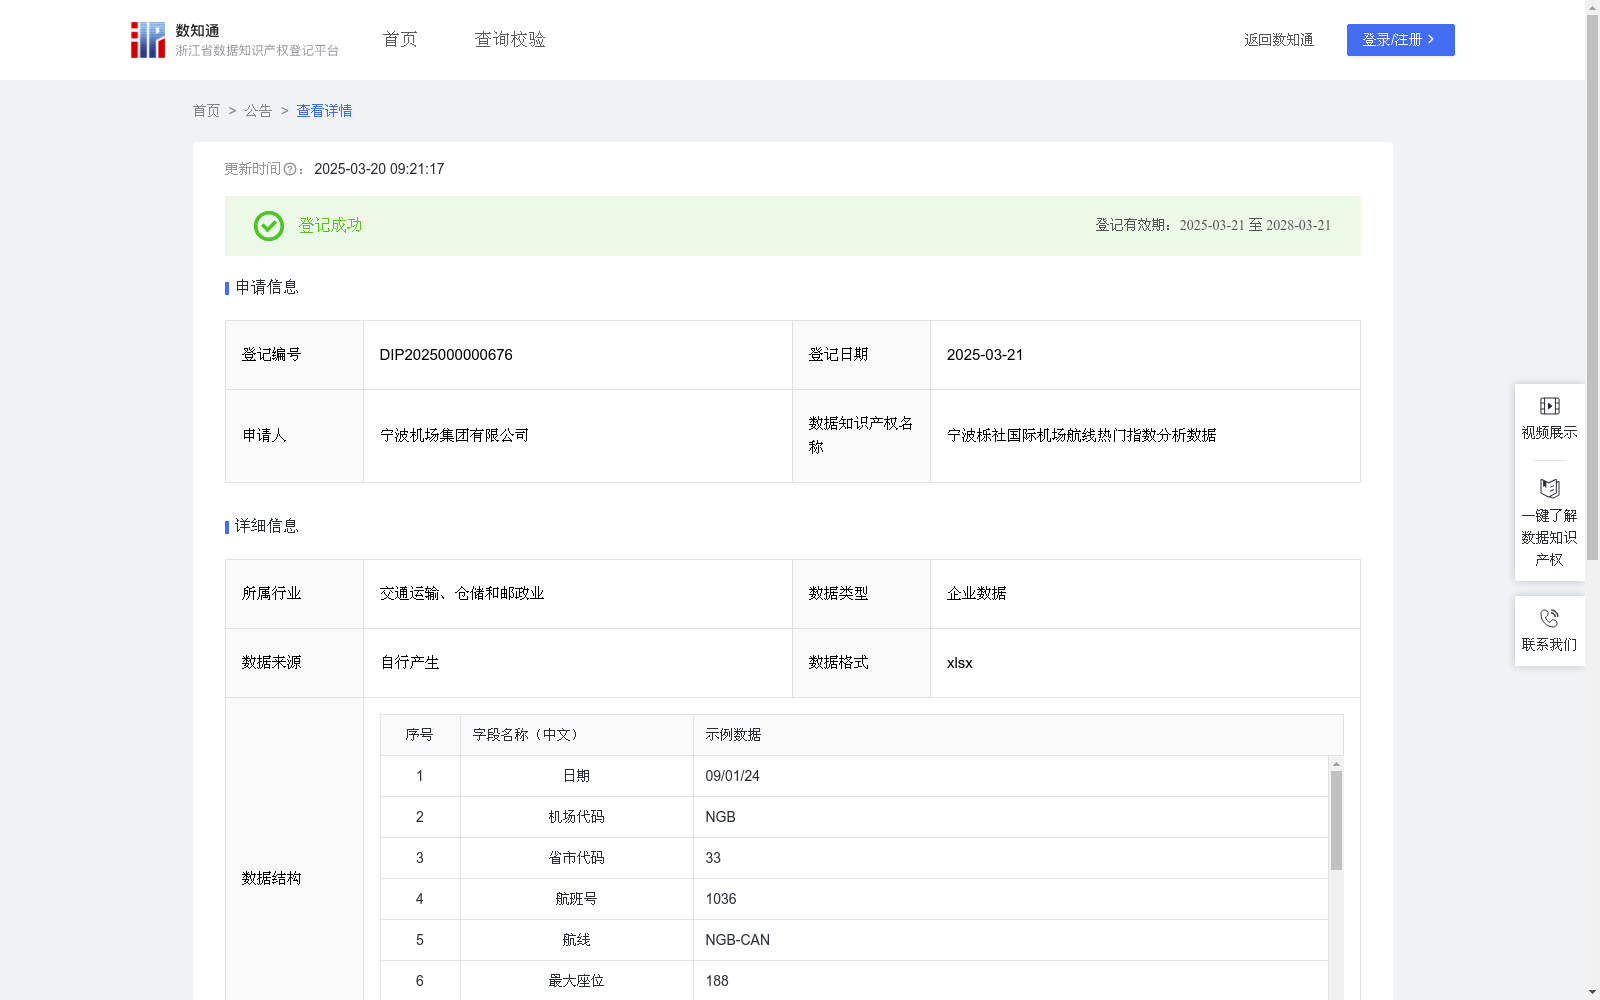
宁波栎社国际机场航线热门指数分析数据
收藏浙江省数据知识产权登记平台2025-03-20 更新2025-03-21 收录
下载链接:
https://www.zjip.org.cn/home/announce/trends/118529
下载链接
链接失效反馈官方服务:
资源简介:
本数据的主要应用场景有以下几方面:
1.旅行社可利用航线热度指数,设计更符合市场需求的旅行套餐,特别是在高峰时段和热门航线上提供更多的旅游产品。另通过分析航线热度指数的变化,旅行社可以预测市场趋势,提前规划资源,如增加热门航线的旅行团数量,或开发新的旅游路线。
2.航空公司可以根据航线热度指数调整航线网络,增加热门航线的班次,或在需求较低的航线上减少班次。根据航线的满载率,调整飞机的运力,以提高运营效率。
3.交通管理部门可以依据航线热度指数,预测机场高峰时段的流量,提前做好交通规划和调度,如增加公共交通的班次,优化交通流向。
4.广告商可以利用航线热度指数优化广告投放的时间和地点,如在高峰时段和高满载率航线上增加广告投放,以提高广告效果。1.数据收集和预处理:数据收集:从公司航班保障平台中获取 日期、机场代码、省市代码、航班号、航线、最大座位、起降架次、起降时间、成人数量、儿童数量、婴儿数量。对采集到的原始数据进行处理,去除缺失和异常数据。 2.计算满载率=(成人数量+儿童数量+婴儿数量)/最大座位。 3.时段分类:将起降时间分为高峰时段和非高峰时段。设定:高峰时段:07:00-09:00 和 17:00-19:00;非高峰时段:其余时间;对于每个航班,根据其起降时间判断属于高峰还是非高峰,并分别计数。 4.加权起降架次:加权起降架次=起降架次×时段权重×满载率权重;其中时段权重:高峰时段为1.5,非高峰时段为1;满载率权重:满载率超过80%,则权重为1,每降低10%,权重减少0.1。 5. 航线热度指数计算:对于每条航线,计算其所有航班的加权起降架次总和,以此作为航线热度指数:航线热度指数=∑(加权起降架次): 6.航线热度排名:根据航线热度指数对所有航线进行排序,得到航线热度排名。
Main application scenarios of this dataset are as follows:
1. Travel agencies can use the route heat index to design travel packages that better align with market demand, especially by providing more tourism products during peak hours and on popular routes. By analyzing changes in the route heat index, travel agencies can also predict market trends and plan resources in advance, such as increasing the number of tour groups on popular routes or developing new travel itineraries.
2. Airlines can adjust their route networks based on the route heat index: increasing flight frequencies on popular routes or reducing frequencies on routes with low demand. They can also adjust aircraft capacity according to the load factor of routes to improve operational efficiency.
3. Traffic management departments can predict airport traffic flow during peak hours using the route heat index, and carry out advance traffic planning and scheduling, such as increasing public transport frequencies and optimizing traffic flow directions.
4. Advertisers can use the route heat index to optimize the timing and location of advertising placements, such as increasing advertising deliveries during peak hours and on routes with high load factors, to enhance advertising effectiveness.
Data collection and preprocessing:
1. Data collection: Obtain date, airport code, province and city code, flight number, route, maximum seats, takeoff and landing sorties, takeoff and landing time, number of adults, number of children, and number of infants from the company's flight support platform. Process the collected raw data by removing missing and abnormal data.
2. Calculate load factor: Load Factor = (Number of Adults + Number of Children + Number of Infants) / Maximum Seats.
3. Time period classification: Divide takeoff and landing time into peak hours and non-peak hours. The specified time ranges are: Peak hours: 07:00-09:00 and 17:00-19:00; Non-peak hours: all remaining time. For each flight, determine whether it belongs to peak or non-peak hours based on its takeoff and landing time, and perform separate counts.
4. Weighted takeoff and landing sorties: Weighted Takeoff and Landing Sorties = Takeoff and Landing Sorties × Time Period Weight × Load Factor Weight. Where the time period weight: 1.5 for peak hours, 1 for non-peak hours; Load factor weight: if the load factor exceeds 80%, the weight is 1, and the weight decreases by 0.1 for every 10% reduction in load factor.
5. Route heat index calculation: For each route, calculate the sum of the weighted takeoff and landing sorties of all its flights, which serves as the route heat index: Route Heat Index = ∑(Weighted Takeoff and Landing Sorties).
6. Route heat ranking: Sort all routes based on their route heat index to obtain the route heat ranking.
提供机构:
宁波机场集团有限公司
创建时间:
2025-02-11
搜集汇总
数据集介绍
背景与挑战
背景概述
该数据集记录了宁波栎社国际机场的航线运营数据,包括航班信息、满载率和航线热度指数等,适用于航线优化、市场预测和广告投放等多个应用场景。
以上内容由遇见数据集搜集并总结生成


