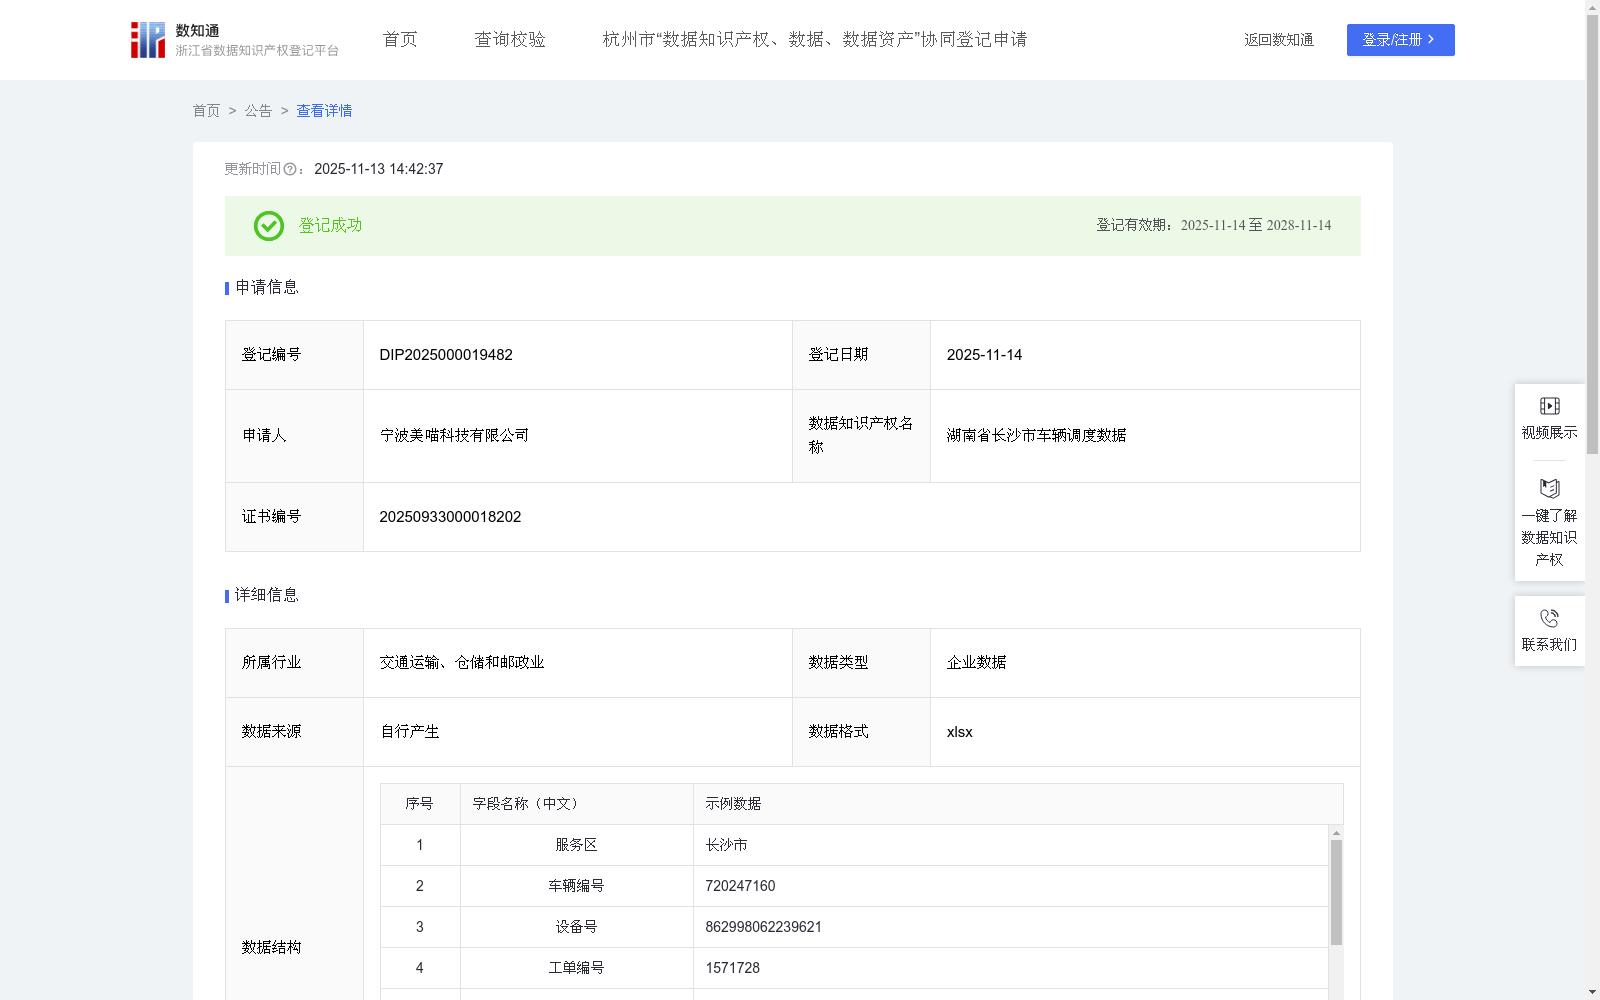
湖南省长沙市车辆调度数据
收藏浙江省数据知识产权登记平台2025-11-13 更新2025-11-14 收录
下载链接:
https://www.zjip.org.cn/home/announce/trends/8398559
下载链接
链接失效反馈官方服务:
资源简介:
通过调度后首个订单间隔、24小时订单数及调度合理性等指标,综合评估每次车辆搬运的效果,实现量化管理。通过分析高SES值的时空分布,优化投放策略;同时支持调度路径分析,优先选择距离短、成效高的搬运路线,降低无效运输成本。系统还可设置预警机制,当实际评分显著低于预期时触发提醒,实现过程监控与问题追溯;该数据集合可为共享出行平台提供运力调度优化参考,为城市交通管理部门输出热点区域与时段的出行趋势分析,也可为物流、电单车运营等企业提供数据驱动的调度决策支持。不仅提升企业内部调度效率与自动化水平,还可作为标准化评估工具,助力上下游企业协同优化资源配置,推动运营精细化与智能化发展。用调度有效性可以得到区域用车需求,调度有效性评分综合越高的区域,对于调动后的区域用车的需求旺盛,可以衍生出对公共交通的需求旺盛,为公共交通服务提供者分布公交交通的疏密以及公共交通的频率做决策复制。1.数据采集:记录每次车辆调度任务的相关信息,包括:服务区、车辆编号、设备号、工单编号、运维人员ID、起始地点、投放地点、调度距离(米)、调度开始时间、调度结束时间、调度后首个订单间隔(分钟)、调度后24小时订单数。2.数据处理:对采集的原始数据进行清洗,剔除缺失值与异常记录。基于调度完成后的使用情况,计算关键指标:首个订单响应时间与24小时内订单数量。结合调度时间、空间距离与区域特征,评估调度行为的合理性。调度有效性评分 =首单响应得分+ 24小时订单数得分+合理性调整分。首单响应得分:反映车辆投放后被使用的速度。调度后首个订单间隔≤5(分钟):首单响应得分得50分;5<调度后首个订单间隔在≤15(分钟):首单响应得分得40分;15<调度后首个订单间隔在≤30(分钟):首单响应得分得30分;30<调度后首个订单间隔在≤60分钟:首单响应得分得20分;60<调度后首个订单间隔在≤120分钟:首单响应得分得10分;调度后首个订单间隔>120分钟:首单响应得分得0分。24小时订单数得分:衡量车辆在目标区域的使用强度。24小时订单数≥10(单):24小时订单数得分得50分;7≤24小时订单数≤9(单):24小时订单数得分得40分;5≤24小时订单数≤6(单):24小时订单数得分得30分;3≤24小时订单数≤4(单):24小时订单数得分得20分;1≤24小时订单数≤2(单):24小时订单数得分10分;24小时订单数为0单:24小时订单数得分得0分。合理性调整分:起止点同服务区且距离<500米:合理性调整分-5分(短距无效调度);调度距离>5km且首单>60分钟:合理性调整分-5分(远距未见效);调度时间开始在12:00后调度时间在14:00前的,且订单少于3个订单:合理性调整分-5分。3. 根据调度有效性评分进行调度效果判定:调度有效性评分≥80分:评为有效调度;调度有效性评分在60–79分(含60):评为基本有效;调度有效性评分在40–59分(含40):评为低效调度;调度有效性评分<40分:评为无效调度。
Comprehensively evaluate the performance of each vehicle dispatching task using metrics including the interval to the first order after dispatching, 24-hour order volume, and dispatching rationality, to achieve quantitative management. Optimize deployment strategies by analyzing the spatiotemporal distribution of high SES values; meanwhile, support dispatching route analysis to prioritize short-distance and high-efficiency relocation routes, reducing invalid transportation costs. The system also supports setting up an early warning mechanism, which triggers reminders when the actual score is significantly lower than expected, enabling process monitoring and problem traceability. This dataset can provide reference for capacity dispatching optimization for ride-hailing platforms, output travel trend analysis of hotspots and peak hours for urban traffic management departments, and offer data-driven dispatching decision support for enterprises such as logistics and e-scooter operation. It not only improves the dispatching efficiency and automation level of internal enterprise operations, but also serves as a standardized evaluation tool to help upstream and downstream enterprises collaboratively optimize resource allocation and promote refined and intelligent operational development.
By using dispatching effectiveness scores, regional vehicle demand can be derived. Regions with higher comprehensive dispatching effectiveness scores correspond to stronger vehicle demand after dispatching, which can also indicate strong public transport demand, providing decision-making basis for public transport service providers to adjust bus density and operating frequency.
1. Data Collection: Record relevant information of each vehicle dispatching task, including: service area, vehicle number, equipment ID, work order number, operation and maintenance staff ID, starting location, deployment location, dispatching distance (meters), dispatching start time, dispatching end time, interval to the first order after dispatching (minutes), and 24-hour order volume after dispatching.
2. Data Processing: Clean the collected raw data by removing missing values and abnormal records. Calculate key indicators based on the post-dispatching usage status: first order response time and 24-hour order volume. Evaluate the rationality of dispatching behavior by combining dispatching time, spatial distance and regional characteristics.
The dispatching effectiveness score is calculated as: First Order Response Score + 24-hour Order Volume Score + Rationality Adjustment Score.
First Order Response Score: reflects the speed at which deployed vehicles are utilized.
- ≤5 minutes (interval to first order after dispatching): 50 points
- 5 < interval ≤15 minutes: 40 points
- 15 < interval ≤30 minutes: 30 points
- 30 < interval ≤60 minutes: 20 points
- 60 < interval ≤120 minutes: 10 points
- >120 minutes: 0 points
24-hour Order Volume Score: measures the usage intensity of vehicles in the target area.
- ≥10 orders: 50 points
- 7 ≤ order volume ≤9 orders: 40 points
- 5 ≤ order volume ≤6 orders: 30 points
- 3 ≤ order volume ≤4 orders: 20 points
- 1 ≤ order volume ≤2 orders: 10 points
- 0 orders: 0 points
Rationality Adjustment Score:
- Same service area for start and end points with distance <500 meters: -5 points (short-distance invalid dispatching)
- Dispatching distance >5km and interval to first order >60 minutes: -5 points (long-distance dispatching with no effective usage)
- Dispatching starts between 12:00 and 14:00 with order volume <3: -5 points
3. Dispatching Effect Evaluation:
- Dispatching effectiveness score ≥80: Rated as Effective Dispatching
- 60 ≤ score ≤79: Rated as Basically Effective Dispatching
- 40 ≤ score ≤59: Rated as Low-efficiency Dispatching
- Score <40: Rated as Invalid Dispatching
提供机构:
宁波美喵科技有限公司
创建时间:
2025-09-05
搜集汇总
数据集介绍
背景与挑战
背景概述
该数据集包含湖南省长沙市的车辆调度记录,共502条数据,每日更新,涵盖调度距离、时间、订单响应和有效性评分等关键指标。它通过算法评估调度效果,支持运力优化和城市交通管理决策,适用于共享出行、物流等领域,提升调度效率和智能化水平。
以上内容由遇见数据集搜集并总结生成


