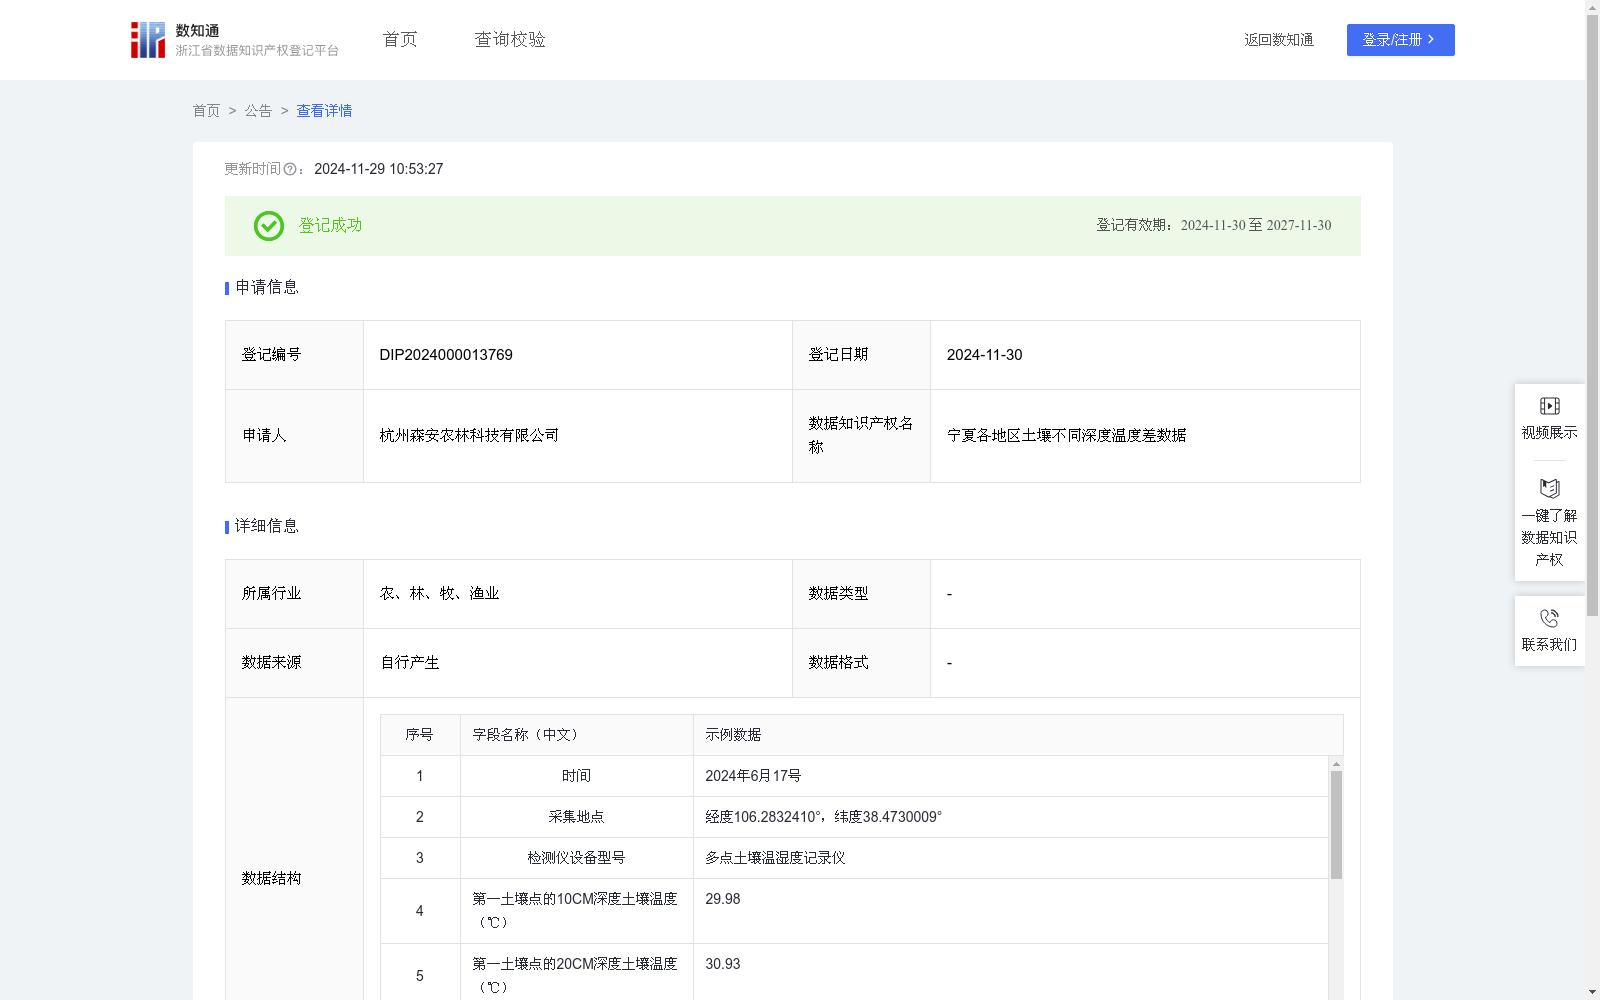
宁夏各地区土壤不同深度温度差数据
收藏浙江省数据知识产权登记平台2024-11-29 更新2024-11-30 收录
下载链接:
https://www.zjip.org.cn/home/announce/trends/91217
下载链接
链接失效反馈官方服务:
资源简介:
研究10CM及20CM深度的土壤温度差,可以揭示该层土壤温度的垂直分布规律。这种温度梯度对于理解土壤热传递过程、土壤水分蒸发、土壤微生物活动等具有重要意义。大多数作物的根系主要分布在土壤表层以下的一定深度范围内,研究该层土壤温度差有助于了解作物根系活动层的温度状况。通过调节土壤温度,可以优化作物生长环境,提高作物产量和品质。另外可结合地理信息系统(GIS)技术,将各地点的土壤地理数据和温度差信息进行深度整合和分析,绘制位置-温度差地图,以直观的可视化形式呈现给用户。1数据采集:每天中午12.00对宁夏不同地点随机在方圆1米直径内采集3个土壤点,3个土壤点各采集10CM及20CM深度土壤温度数据;2数据处理:将数据去噪、优化、补全;3数据加工:通过将20CM深度土壤温度与10CM深度土壤温度数据进行相减,得出3个采样点的土壤温度差,分别为T1、T2和T3,则该地点的土壤温度差平均值T4=(T1+T2+T3)/3;3数据应用:根据土壤温度差平均值T4有助于了解作物根系活动层的温度状况。
Studying the soil temperature difference at depths of 10 cm and 20 cm can reveal the vertical distribution pattern of soil temperature in this layer. This temperature difference is of great significance for understanding soil heat transfer processes, soil water evaporation, soil microbial activities and other related aspects. The root systems of most crops are mainly distributed within a certain depth range below the soil surface; thus, studying the soil temperature difference in this layer helps to understand the temperature conditions of the crop root activity zone. By regulating soil temperature, the crop growth environment can be optimized, and crop yield and quality can be improved. In addition, combined with Geographic Information System (GIS) technology, in-depth integration and analysis can be conducted between soil geographic data and temperature difference information of each site, and a location-temperature difference map can be drawn to present to users in an intuitive visual form.
1. Data Collection: At 12:00 noon every day, 3 soil sampling points are randomly selected within a 1-meter diameter circle at different locations in Ningxia, and soil temperature data at depths of 10 cm and 20 cm are collected for each of the 3 sampling points.
2. Data Processing: Denoise, optimize and impute the collected data.
3. Data Refinement: Subtract the soil temperature data at 10 cm depth from that at 20 cm depth to obtain the soil temperature differences of the 3 sampling points, denoted as T1, T2 and T3 respectively. The average soil temperature difference T4 of this site is calculated as T4 = (T1 + T2 + T3)/3.
4. Data Application: The average soil temperature difference T4 helps to understand the temperature conditions of the crop root activity zone.
提供机构:
杭州森安农林科技有限公司
创建时间:
2024-10-28
搜集汇总
数据集介绍
以上内容由遇见数据集搜集并总结生成


