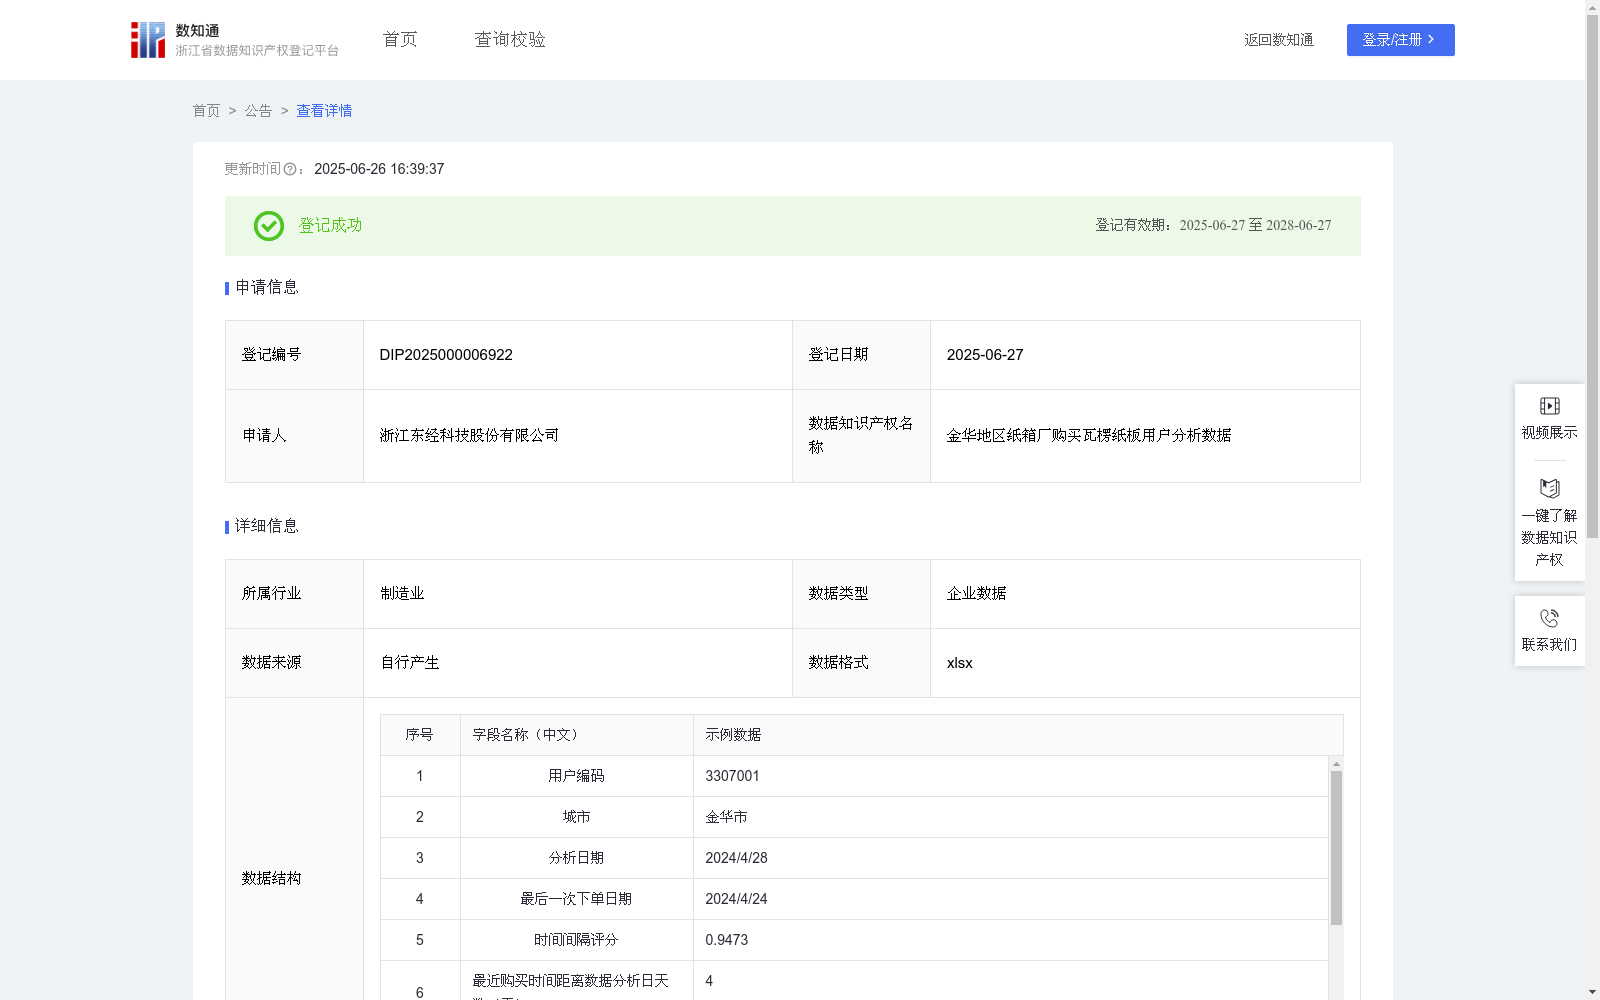
金华地区纸箱厂购买瓦楞纸板用户分析数据
收藏资源简介:
基于该地区纸箱厂购买瓦楞纸的订单购买数据数据,根据用户购买金额、购买频率、购买间隔等数据算法进行综合评分,通过合理的模型识别识别高价值客户,为精细化营销合理的用户粘性分析,帮助本行业企业进行精准营销,深度分析用户购买力、购买粘性等,用户综合评分越高,说明用户粘性越高。在自研的纸包装数据中台中,通过对订单的相关数据,进行加工、分析,最终生成上述数据。1、数据来源:企业内部订单数据。2、数据处理:RFM数据模型, 通过对用户最近一次购买的时间间隔评分R,购买频率评分F,购买金额评分M进行评分处理。1.计算每个用户的 “最近购买时间距离数据分析日天数”,最近购买时间距离数据分析日天数 = 分析日期 - 最后一次下单日期,统计所有用户的 “最近购买时间距离数据分析日天数”,找出最大值,记为 “最大购买时间间隔”,计算时间间隔评分 R = (最大购买时间间隔 - 最近购买时间距离数据分析日天数)/ 最大购买时间间隔;2.统计每个用户最近购买次数,即 “最近消费频率”,找出所有用户中 “最近消费频率” 的最大值,记为 “最高消费频率”,计算消费频率评分 F= 最近消费频率 / 最高消费频率;统计每个用户最近累计购买金额,即 “最近购买金额”,找出所有用户中 “最近购买金额” 的最大值,记为 “最高购买金额”,计算购买金额评分 M = 最近购买金额 / 最高购买金额。最后进行整合RFM=3*R+3*F+4*M(四舍五入保留小数点后四位)得出用户综合评分,综合评分在0-10分之间,综合评分越高,用户粘性越高
This dataset is constructed based on the corrugated paper order purchase data of local carton factories. A comprehensive scoring algorithm is applied based on users' purchase amount, purchase frequency, purchase interval and other relevant metrics, to identify high-value customers via a reasonable model, conduct proper user stickiness analysis for refined marketing, assist enterprises in this industry to carry out precise marketing, and deeply analyze users' purchasing power, purchase stickiness and other indicators. The higher the user's comprehensive score, the greater the user stickiness. The aforementioned dataset is finally generated by processing and analyzing relevant order data on the self-developed paper packaging data platform. 1. Data Source: Internal enterprise order data. 2. Data Processing: The RFM data model is adopted for scoring, which separately scores the time interval since the user's last purchase (R), purchase frequency (F), and purchase amount (M): 1. Calculate the 'days since the last purchase from the data analysis date' for each user, which is defined as Analysis Date minus Last Order Date. Count this metric for all users, identify the maximum value as the 'maximum purchase interval', and calculate the time interval score R = (Maximum Purchase Interval - Days Since Last Purchase from Data Analysis Date) / Maximum Purchase Interval; 2. Count the number of recent purchases of each user, i.e., 'recent consumption frequency'. Identify the maximum value of this metric among all users as the 'maximum consumption frequency', and calculate the consumption frequency score F = Recent Consumption Frequency / Maximum Consumption Frequency; Count the cumulative recent purchase amount of each user, i.e., 'recent purchase amount'. Identify the maximum value of this metric among all users as the 'maximum purchase amount', and calculate the purchase amount score M = Recent Purchase Amount / Maximum Purchase Amount. Finally, integrate the three scores to obtain the user comprehensive score with the formula RFM = 3*R + 3*F + 4*M (rounded to 4 decimal places). The comprehensive score ranges from 0 to 10, and the higher the score, the higher the user stickiness.