
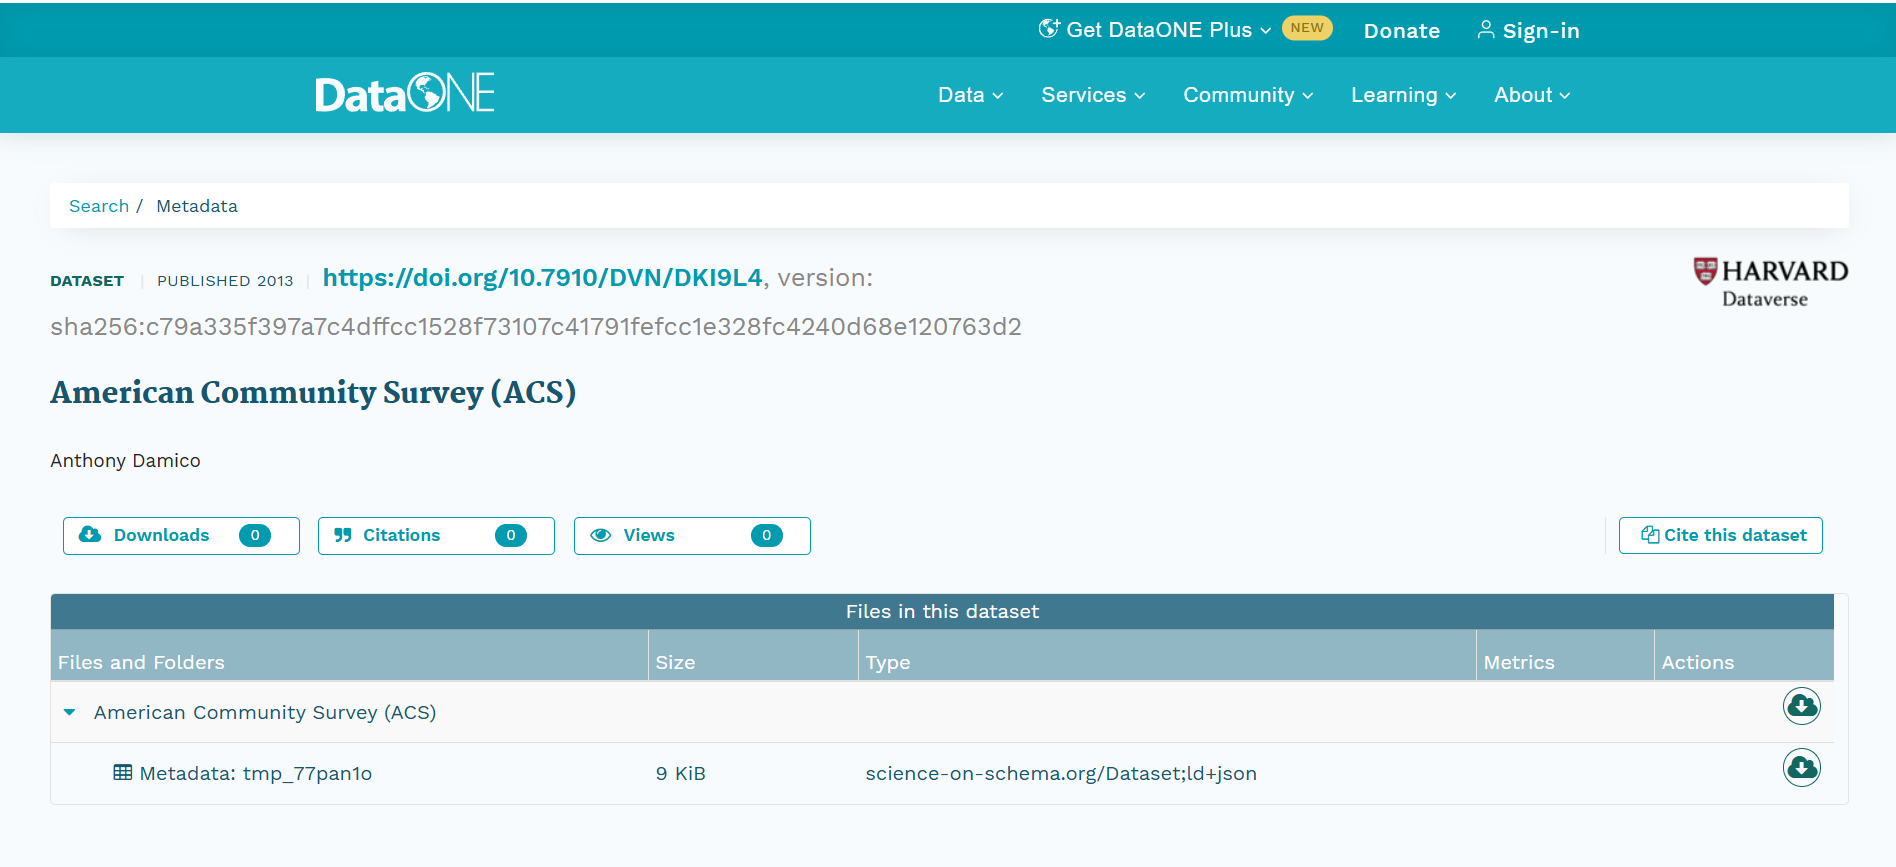
American Community Survey (ACS)
收藏DataONE2015-04-11 更新2024-06-27 收录
下载链接:
https://search.dataone.org/view/sha256:c79a335f397a7c4dffcc1528f73107c41791fefcc1e328fc4240d68e120763d2
下载链接
链接失效反馈官方服务:
资源简介:
analyze the american community survey (acs) with r and monetdb experimental. think of the american community survey (acs) as the united states' census for off-years - the ones that don't end in zero. every year, one percent of all americans respond, making it the largest complex sample administered by the u.s. government (the decennial census has a much broader reach, but since it attempts to contact 100% of the population, it's not a sur vey). the acs asks how people live and although the questionnaire only includes about three hundred questions on demography, income, insurance, it's often accurate at sub-state geographies and - depending how many years pooled - down to small counties. households are the sampling unit, and once a household gets selected for inclusion, all of its residents respond to the survey. this allows household-level data (like home ownership) to be collected more efficiently and lets researchers examine family structure. the census bureau runs and finances this behemoth, of course. the dow nloadable american community survey ships as two distinct household-level and person-level comma-separated value (.csv) files. merging the two just rectangulates the data, since each person in the person-file has exactly one matching record in the household-file. for analyses of small, smaller, and microscopic geographic areas, choose one-, three-, or fiv e-year pooled files. use as few pooled years as you can, unless you like sentences that start with, \"over the period of 2006 - 2010, the average american ... [insert yer findings here].\" rather than processing the acs public use microdata sample line-by-line, the r language brazenly reads everything into memory by default. to prevent overloading your computer, dr. thomas lumley wrote the sqlsurvey package principally to deal with t his ram-gobbling monster. if you're already familiar with syntax used for the survey package, be patient and read the sqlsurvey examples carefully when something doesn't behave as you expect it to - some sqlsurvey commands require a different structure (i.e. svyby gets called through svymean) and others might not exist anytime soon (like svyolr). gimme some good news: sqlsurvey uses ultra-fast monetdb (click here for speed tests), so follow the monetdb installation instructions before running this acs code. monetdb imports, writes, recodes data slowly, but reads it hyper-fast . a magnificent trade-off: data exploration typically requires you to think, send an analysis command, think some more, send another query, repeat. importation scripts (especially the ones i've already written for you) can be left running overnight sans hand-holding. the acs weights generalize to the whole united states population including individuals living in group quarters, but non-residential respondents get an abridged questionnaire, so most (not all) analysts exclude records with a relp variable of 16 or 17 right off the bat. this new github repository contains four scripts: 2005-2011 - download all microdata.R create the batch (.bat) file needed to initiate the monet database in the future download, unzip, and import each file for every year and size specified by the user create and save household- and merged/person-level replicate weight complex sample designs create a well-documented block of code to re-initiate the monet db server in the future fair warning: this full script takes a loooong time. run it friday afternoon, commune with nature for the weekend, and if you've got a fast processor and speedy internet connection, monday morning it should be ready for action. otherwise, either download only the years and sizes you need or - if you gotta have 'em all - run it, minimize it, and then don't disturb it for a week. 2011 single-year - analysis e xamples.R run the well-documented block of code to re-initiate the monetdb server load the r data file (.rda) containing the replicate weight designs for the single-year 2011 file perform the standard repertoire of analysis examples, only this time using sqlsurvey functions 2011 single-year - variable reco de example.R run the well-documented block of code to re-initiate the monetdb server copy the single-year 2011 table to maintain the pristine original add a new age category variable by hand add a new age category variable systematically re-create then save the sqlsurvey replicate weight complex sample design on this new table close everything, then load everything back up in a fresh instance of r replicate a few of the census statistics. no muss, no fuss replicate census estimates - 2011.R run the well-documented block of code to re-initiate the monetdb server load the r data file (.rda) containing the replicate weight designs for the single-year 2011 file match every nation wide statistic on the census bureau's estimates page, using sqlsurvey functions click here to view these four scripts for more detail about the american community survey (acs), visit: < ul> the us census bureau's acs homepage the american factfinder homepage the american community survey's wikipedia page the census bureau's acs frequently asked questions page notes: if you're just looking for a couple data point s, you ought to give the census bureau's american factfinder a whirl. it's a table creator (click here to watch me blab about table creators), so it's easy-to-use but inflexible. here's a li'l tip: if you run a statistic using american factfinder and then the same statistic using these scripts, they will be close but won't match exa ctly. it's not a mistake, and both are methodologically correct. every now and then, grumpy lawmakers threaten to defund the acs because, well, it's expensive. use it or lose it. since data types in sql are not as plentiful as they are in the r language, the definition of a monet database-backed complex design object requires a cutoff be specified between the categorical variables and the linear ones. that cut point gets defined using the check.factors argument in the sqlsurvey() and sqlrepsurvey() function calls. check.factors defaults to ten, but can be raised or lowered as needed. here's how it works: if the column would be a character string or factor inside an r data frame, the sql database stores it as a varchar column. if the column would be numeric o r integer in an r data frame, but has fewer than eleven unique values, the sql database also stores it as a varchar column. if the column would be numeric or integer in an r data frame, but has at least eleven unique values, the sql database stores it as a double (that's sql-spe ak for numeric). unless specified by the question's phrasing, most acs variables should be treated as point-in-time, as opposed to either annualized or ever during the year. this distinction is particularly important for health insurance coverage. think about these three statistics -- the number of americans who won't have health insurance at least once during this year the number of americans without health insurance right now < li>the number of americans who won't ever have health insurance during this year -- the number of americans without health insurance right now is the point-in-time variable, smaller than the at least once number but larger than the ever number. although the automated ftp download program for this data set only retrieves files back as far as 2005, a nationwide version of the american community survey has been conducted since 2000. i skipped those years for two reasons -- the sample size (the true strength of the modern acs) wasn't very large on the older files (the 2004 and 2011 single-year person-level files are 54mb and 580mb, respectively). there's no reason to import these files into a monet database. the replicate weighted design wasn't implemented until 2005, so the creation of a complex sample survey object isn't possible. if you need to calculate standard errors for earlier years, you'll have to rely on a pita generalized variance formula instead. evidence: the published estimates prior to 2005 don't include error columns. -- but if it's critical for you to analyze this early data, those tables should be small enough to read into memory with read.csv. use wgtp for household-weighted and pwgtp for person-weighted statistics with wtd.mean and wtd.quantile functions in the Hmisc package. confidential to sas, spss, stata, sudaan users: the decennial census is enshrined in our constitution. your statistical software isn't. time to transition to r. :D
本教程基于R语言与MonetDB实验性分析美国社区调查(American Community Survey, ACS)数据。
美国社区调查(ACS)是美国的非十年期年度调查——即在末尾不为0的年份开展的普查类项目。每年有1%的美国民众参与调查,使其成为美国政府管理的规模最大的复杂抽样调查项目(十年一次的人口普查覆盖范围更广,但因其尝试联系全体国民,不属于抽样调查范畴)。
ACS聚焦民众生活状况调研,尽管问卷仅包含约300个涉及人口统计、收入与保险的问题,但其数据在州以下地理层级往往具备准确性;根据合并的调查年份数,甚至可细化至小型县域范围。本次调查以家庭为抽样单位,一旦某家庭被抽中,其所有家庭成员均需参与调研。这使得家庭层面数据(如住房自有率)的采集效率更高,也便于研究者分析家庭结构。当然,该项目由美国人口普查局负责运营并提供资金支持。
可下载的ACS数据包含两份独立的文件:家庭层面与个人层面的逗号分隔值(Comma-Separated Values, CSV)文件。将两份文件合并即可重构完整数据集,因为个人文件中的每一位受访者在家庭文件中均存在且仅存在一条匹配记录。
若需针对小型、超小型乃至微观地理区域开展分析,可选择1年、3年或5年合并数据集。除非你希望写出"2006-2010年期间,美国民众平均……[插入研究结果]"这类表述,否则应尽量使用合并年限最少的数据集。
传统的逐行处理ACS公共使用微数据样本的方式效率低下,而R语言默认会将所有数据加载至内存中,极易导致计算机内存过载。为解决这一问题,托马斯·拉勒姆(Thomas Lumley)博士开发了sqlsurvey包,专门用于处理这一“内存杀手”。若你已熟悉survey包的语法,请耐心研读sqlsurvey的示例代码——当部分功能未按预期运行时,需注意其语法结构存在差异(例如svyby需通过svymean调用),且部分功能短期内暂未实现(如svyolr)。
好消息是:sqlsurvey依托超高速的MonetDB数据库(点击此处查看性能测试),因此在运行本ACS分析代码前,请务必按照MonetDB的安装指引完成配置。MonetDB的数据导入、写入与重编码速度较慢,但读取速度极快。这是一个绝佳的权衡:数据探索通常需要先思考、发送分析命令,再进一步思考、发送下一条查询,如此往复。而导入脚本(尤其是我已为你编写完成的脚本)可以在无需人工值守的情况下整夜运行。
ACS的抽样权重可推广至全美国人口,包括居住在集体住宿场所的个体。但非居住类受访者仅需填写简化版问卷,因此大多数(并非全部)研究者会直接剔除relp变量值为16或17的记录。
本GitHub仓库包含四个脚本:
1. `2005-2011 - download all microdata.R`:用于下载全部微数据,创建未来初始化Monet数据库所需的批处理(.bat)文件,按用户指定的年份与数据集规模下载、解压并导入每一份文件,创建并保存家庭层面与合并后的个人层面重复加权复杂抽样设计,编写一段文档完善的代码块用于未来重新启动Monet数据库服务器。
温馨提示:完整运行该脚本耗时极长。建议在周五下午启动,利用周末时间等待;若你的处理器性能强劲且网络速度较快,周一早上即可完成准备。若硬件条件一般,要么仅下载你所需的年份与数据集规模,要么直接运行脚本、最小化窗口后静置一周时间。
2. `2011 single-year - analysis examples.R`:运行文档完善的代码块重新启动MonetDB服务器,加载包含2011年单一年份文件重复加权设计的R数据文件(.rda),使用sqlsurvey函数完成一系列标准分析示例。
3. `2011 single-year - variable recode example.R`:运行文档完善的代码块重新启动MonetDB服务器,复制2011年单一年份数据表以保留原始纯净版本,手动新增一个年龄分类变量,系统地新增另一个年龄分类变量,重新创建并保存该新数据表对应的sqlsurvey重复加权复杂抽样设计,关闭所有会话后在全新的R实例中重新加载所有内容,复现若干项人口普查统计数据,操作简便无冗余。
4. `replicate census estimates - 2011.R`:运行文档完善的代码块重新启动MonetDB服务器,加载包含2011年单一年份文件重复加权设计的R数据文件(.rda),使用sqlsurvey函数匹配人口普查局官方页面上的所有全国性统计数据。
点击此处可查看这四个脚本的更多细节。如需了解更多关于美国社区调查(ACS)的信息,请访问:
- 美国人口普查局ACS主页
- 美国数据普查门户(American FactFinder)主页
- 美国社区调查维基百科页面
- 美国人口普查局ACS常见问题页面
## 注意事项
若你仅需获取少量数据点,不妨尝试使用美国人口普查局的American FactFinder工具。它是一款表格生成器(点击此处观看我讲解表格生成器的视频),操作简单但灵活性不足。这里有一个小技巧:若你同时使用American FactFinder与本脚本计算同一项统计数据,两者结果会相近但不会完全一致。这并非程序错误,二者在方法论上均为正确的。
时不时会有态度严苛的议员提议削减ACS的预算,毕竟该项目耗资不菲。请善用该资源,否则终将失去它。
由于SQL支持的数据类型不如R语言丰富,在定义基于Monet数据库的复杂设计对象时,需要指定分类变量与线性变量的分界阈值。该分界阈值可通过`sqlsurvey()`与`sqlrepsurvey()`函数调用中的`check.factors`参数进行设置。`check.factors`的默认值为10,可根据需要调整。其工作原理如下:
- 若某一列在R数据框中为字符型或因子型,SQL数据库会将其存储为`varchar`类型;
- 若某一列在R数据框中为数值型或整型,且唯一值数量少于11个,SQL数据库同样会将其存储为`varchar`类型;
- 若某一列在R数据框中为数值型或整型,且唯一值数量不少于11个,SQL数据库会将其存储为`double`类型(即SQL语境下的数值型)。
除非问卷措辞另有说明,绝大多数ACS变量应被视为时点变量,而非年度累计变量或全年终身变量。这一区分对于健康保险覆盖情况的分析尤为重要。试比较以下三项统计数据:
- 本年度至少有一段时间未拥有健康保险的美国民众数量
- 当下未拥有健康保险的美国民众数量
- 本年度从未拥有过健康保险的美国民众数量
其中,当下未拥有健康保险的人数属于时点变量,其数值介于“至少有一段时间未参保”与“从未参保”之间。
尽管本数据集的自动化FTP下载程序仅能追溯至2005年的数据,但美国社区调查的全国性项目自2000年起便已开展。我未收录2000-2004年的数据主要有两个原因:其一,早期数据集的样本量较小(现代ACS的核心优势正是庞大的样本量),例如2004年单一年份个人层面文件大小为54MB,2011年则为580MB,没有必要将早期小型数据集导入Monet数据库;其二,重复加权抽样设计直至2005年才得以应用,因此无法为早期数据创建复杂抽样调查对象。若你需要为早期年份计算标准误,则需借助繁琐的广义方差公式。佐证:2005年之前发布的官方统计数据并未包含误差列。
不过,如果你确实需要分析早期数据,这些表格的规模足够小,可以直接通过`read.csv`函数加载至R内存中。计算加权统计量时,家庭层面数据使用`wgtp`权重,个人层面数据使用`pwgtp`权重,并调用`Hmisc`包中的`wtd.mean`与`wtd.quantile`函数。
致SAS、SPSS、Stata、SUDAAN用户:十年一次的人口普查是受美国宪法保障的,但你的统计软件并非如此。是时候转向R语言了😉
创建时间:
2023-11-21
搜集汇总
数据集介绍
构建方式
American Community Survey (ACS) 数据集的构建基于美国人口普查局每年进行的社区调查。该调查通过随机抽样方法,从全美范围内选取约350万个家庭进行详细问卷调查。数据收集涵盖了人口统计、经济状况、住房条件和社会参与等多个维度。通过这种系统化的抽样和多维度的数据收集,ACS 数据集能够提供关于美国社区的全面且细致的统计信息。
特点
ACS 数据集以其高度的代表性和广泛的应用领域著称。其数据涵盖了从个人到社区的多个层次,包括但不限于年龄、性别、种族、教育水平、就业状况和收入等关键指标。此外,ACS 数据集还提供了地理编码信息,使得用户能够进行空间分析和区域比较。这些特点使得 ACS 数据集成为社会科学研究、政策制定和商业分析的重要工具。
使用方法
使用 ACS 数据集时,用户可以通过美国人口普查局的官方网站或相关数据分析平台获取数据。数据通常以表格形式提供,用户可以根据需要选择特定年份、地理区域和变量进行下载和分析。常见的使用方法包括描述性统计分析、回归分析和空间分析。此外,ACS 数据集还支持与其他社会经济数据集的整合,以进行更深入的综合研究。
背景与挑战
背景概述
American Community Survey (ACS) 是由美国人口普查局自2005年起定期发布的一项重要调查,旨在提供关于美国社区的详细社会经济数据。该数据集的核心研究问题涵盖了人口统计、住房、就业、教育等多个领域,为政策制定者、研究人员和社会工作者提供了宝贵的信息资源。ACS的发布不仅填补了十年一次的人口普查之间的数据空白,还因其高频率的更新和广泛的地理覆盖范围,对社会科学研究、公共政策分析以及市场调研等领域产生了深远影响。
当前挑战
尽管ACS数据集在社会经济研究中具有重要地位,但其构建和应用过程中仍面临诸多挑战。首先,数据收集的高成本和复杂性使得样本量和覆盖范围受到限制,可能导致数据代表性不足。其次,由于涉及个人隐私,数据匿名化和隐私保护成为一大难题,如何在确保数据安全的同时提供高质量的分析结果是一大挑战。此外,ACS数据的复杂性和多样性也要求研究人员具备高度的专业知识和技能,以准确解读和应用这些数据。
发展历史
创建时间与更新
American Community Survey (ACS) 由美国人口普查局于2005年创建,旨在替代长期运行的年度人口普查。自2005年起,ACS每年进行更新,提供关于美国社区的详细社会、经济和住房数据。
重要里程碑
ACS的一个重要里程碑是其在2005年的正式启动,这一举措标志着美国人口普查局从传统的十年一次的人口普查向更为频繁的数据收集方式的转变。此外,ACS在2010年进行了重大改进,引入了更精细的地理编码和更广泛的数据类别,使其成为研究美国社会经济状况的重要工具。近年来,ACS还增加了对多样性和包容性指标的收集,进一步丰富了其数据内容。
当前发展情况
当前,ACS已成为美国社会科学研究和政策制定的重要数据来源。其数据被广泛应用于教育、医疗、住房和就业等多个领域,为政策制定者提供了详尽的社区分析。ACS的持续更新和扩展,使其能够捕捉到美国社会的快速变化,从而为学术研究和公共政策提供了宝贵的数据支持。此外,ACS的数据开放性和可访问性,也促进了跨学科的研究合作和数据驱动的决策制定。
发展历程
- 美国人口普查局首次提出ACS的概念,作为对传统十年一次人口普查的补充。
- ACS开始进行试点调查,以测试其可行性和数据质量。
- ACS正式取代长期人口调查(Long Form),成为美国人口普查局的主要年度调查工具。
- ACS首次发布全美范围的年度数据,标志着其全面实施的开始。
- ACS数据在2010年人口普查中得到广泛应用,为政策制定和学术研究提供了重要数据支持。
- ACS开始发布五年汇总数据,提供更长时间跨度的统计分析。
- ACS数据被广泛用于评估美国社区的变化和趋势,成为社会科学研究的重要数据源。
常用场景
经典使用场景
在美国社会科学研究领域,American Community Survey (ACS) 数据集被广泛用于分析人口统计学特征、社会经济状况以及住房条件。研究者利用该数据集进行社区层面的分析,以揭示不同社会群体的生活质量、教育水平和就业状况的差异。通过这些分析,ACS 数据集为政策制定者提供了关键的社会经济指标,帮助他们制定和评估社会政策。
实际应用
在实际应用中,ACS 数据集被广泛用于政府决策、城市规划和非营利组织的社会服务设计。例如,地方政府利用 ACS 数据来规划公共交通系统、学校布局和医疗设施的分布。非营利组织则利用这些数据来识别服务不足的社区,并设计针对性的社会援助项目。此外,商业机构也利用 ACS 数据进行市场分析和消费者行为研究,以优化产品和服务。
衍生相关工作
基于 ACS 数据集,许多经典研究工作得以开展,涵盖了从社会学到经济学的多个领域。例如,有研究利用 ACS 数据分析了教育水平与收入之间的关系,揭示了教育在社会流动中的作用。此外,ACS 数据还被用于研究移民对当地经济的影响,以及城市化对环境和社会结构的影响。这些研究不仅丰富了学术知识,也为实际政策制定提供了科学依据。
以上内容由遇见数据集搜集并总结生成



