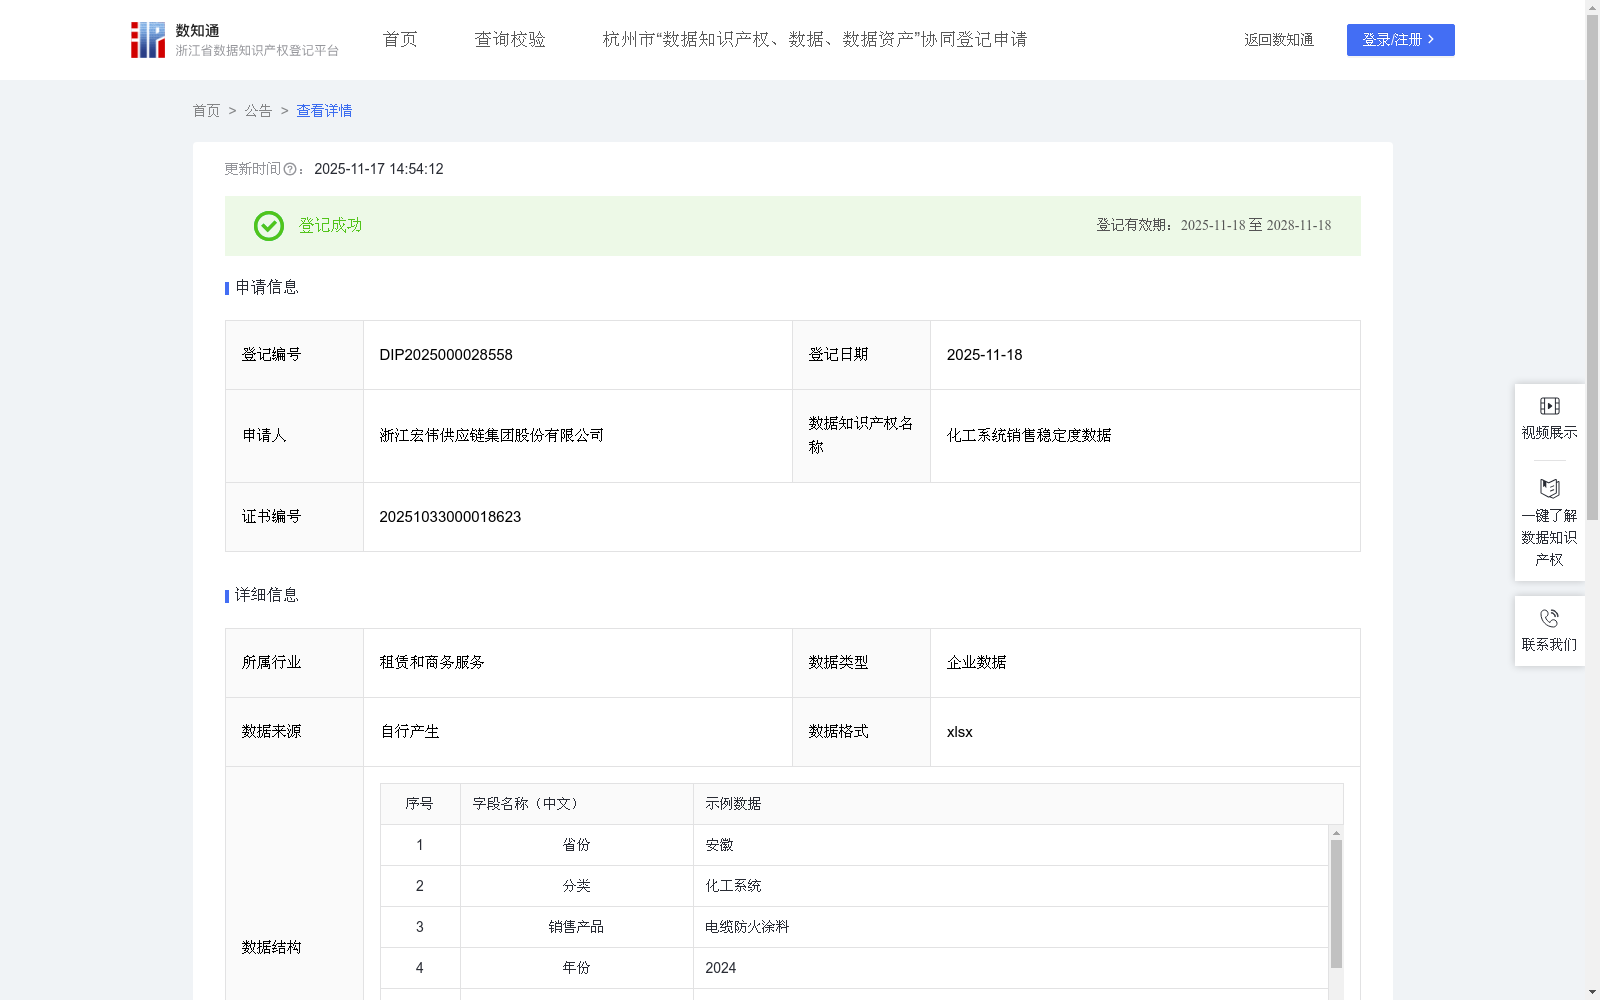
化工系统销售稳定度数据
收藏资源简介:
通过分析化工系统在不同省份的销售稳定系数与销售稳定级别,可为企业的市场决策提供有力支持。该分析广泛应用于以下场景: 评估产品销售表现:基于历史销售数据,全面了解各类产品在不同省份市场的销售稳定度,识别高波动性与高稳定性区域,科学预测未来需求趋势,从而合理平衡采购计划与库存管理,降低缺货或积压风险。1.数据采集:本数据集基于宏伟天马工业互联网平台,采集化工系统在不同省份、一级分类、销售产品、年份、Q1第一季度销售额(万元)、Q2第二季度销售额(万元)、Q3第三季度销售额(万元)、Q4第四季度销售额(万元)等信息。宏伟天马工业互联网平台和本数据集归属于浙江宏伟供应链集团股份有限公司。2.算法加工:计算QAS季度平均销售额(万元)=(Q1第一季度销售额(万元)+Q2第二季度销售额(万元)+Q3第三季度销售额(万元)+Q4第四季度销售额(万元))/4,QV季度方差=((Q1第一季度销售额(万元)-QAS季度平均销售额(万元))²+(Q2第二季度销售额(万元)-QAS季度平均销售额(万元))²+(Q3第三季度销售额(万元)-QAS季度平均销售额(万元))²+(Q4第四季度销售额(万元)-QAS季度平均销售额(万元))²)/4,QSD季度标准差=(QV季度方差)½,用以计算SSC销售稳定系数=QSD季度标准差/QAS季度平均销售额; 利用SSC销售稳定系数来评价化工系统年度销售到该地区的SSL销售稳定级别,判断方法如下:若SSC销售稳定系数≥1.5,则SSL销售稳定级别为不稳定;若SSC销售稳定系数<1.5,则SSL销售稳定级别为稳定。
Analyzing the sales stability coefficient and sales stability level of chemical systems across different provinces can provide robust support for enterprises' market decision-making. This analysis is widely applied in the following scenarios: Assess product sales performance: Based on historical sales data, comprehensively understand the sales stability of various products in provincial markets, identify regions with high volatility and high stability, scientifically forecast future demand trends, thereby rationally balancing procurement planning and inventory management, and reducing the risk of stockouts or overstock. 1. Data Collection: This dataset is collected based on the Hongwei Tianma Industrial Internet Platform, covering information such as provinces, primary classifications, sold products, years, Q1 (First Quarter) sales revenue (ten thousand RMB), Q2 (Second Quarter) sales revenue (ten thousand RMB), Q3 (Third Quarter) sales revenue (ten thousand RMB), and Q4 (Fourth Quarter) sales revenue (ten thousand RMB) of chemical systems. The Hongwei Tianma Industrial Internet Platform and this dataset belong to Zhejiang Hongwei Supply Chain Group Co., Ltd. 2. Algorithm Processing: Calculate QAS (Quarterly Average Sales, ten thousand RMB) = (Q1 sales revenue + Q2 sales revenue + Q3 sales revenue + Q4 sales revenue) / 4; QV (Quarterly Variance) = [(Q1 sales revenue - QAS)² + (Q2 sales revenue - QAS)² + (Q3 sales revenue - QAS)² + (Q4 sales revenue - QAS)²] / 4; QSD (Quarterly Standard Deviation) = √(QV). The SSC (Sales Stability Coefficient) is calculated as SSC = QSD / QAS. The SSL (Sales Stability Level) of the chemical system's annual sales in the target region is evaluated using the SSC, with the following judgment criteria: If SSC ≥ 1.5, the SSL is classified as unstable; if SSC < 1.5, the SSL is classified as stable.