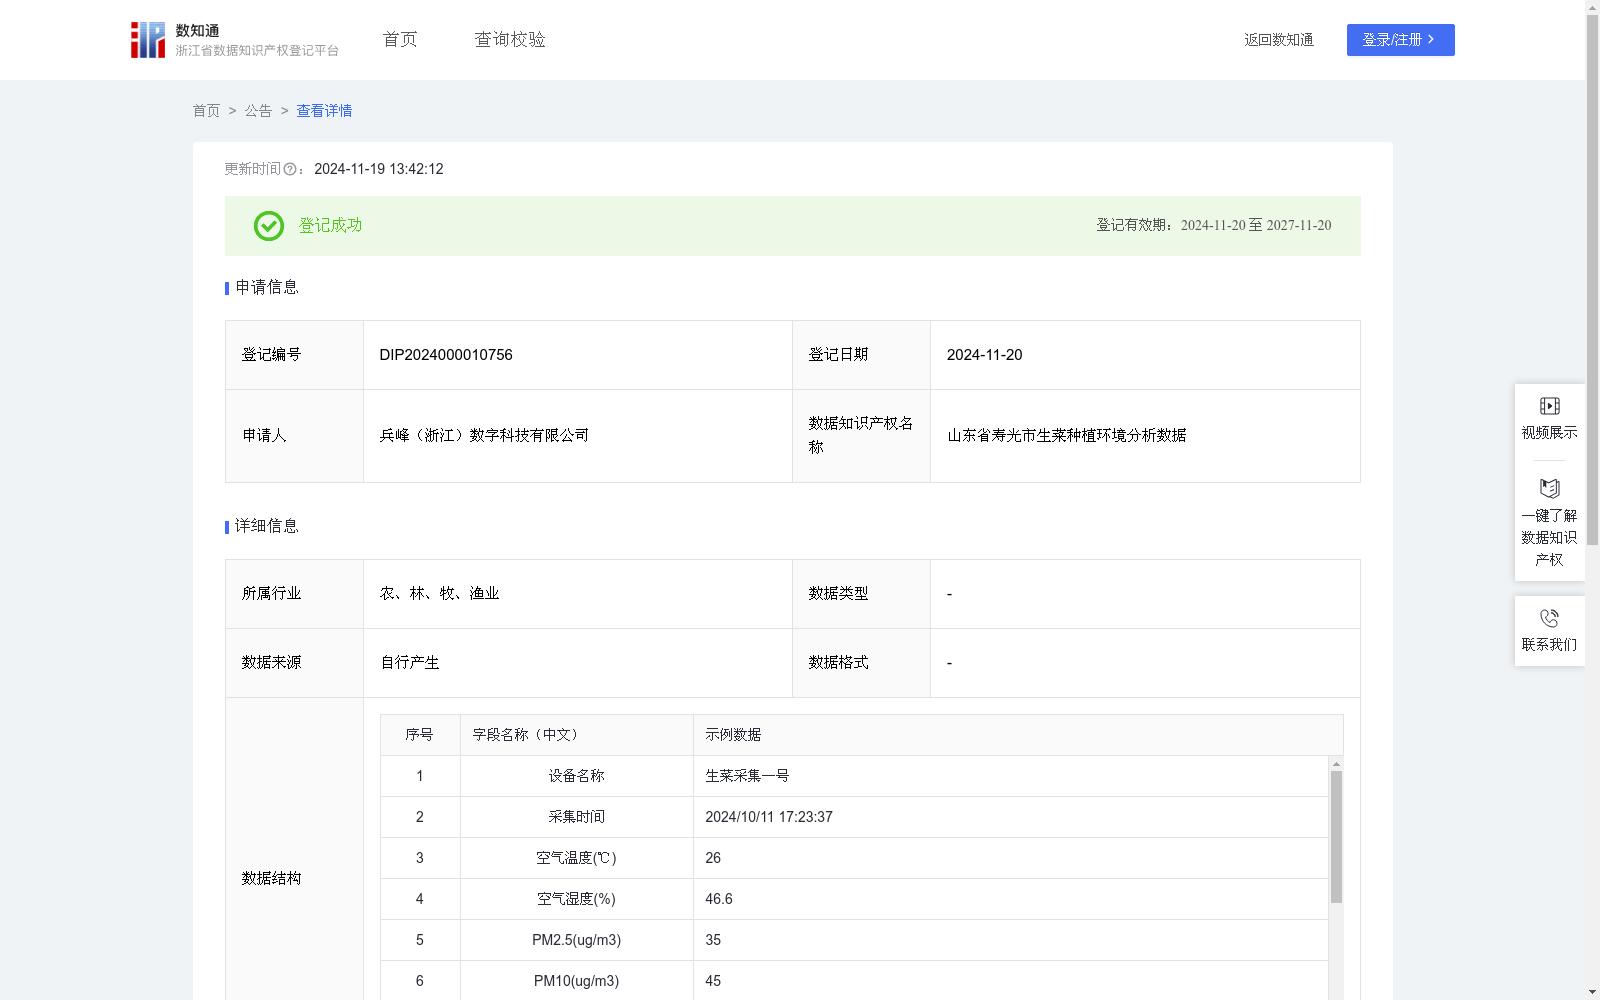
山东省寿光市生菜种植环境分析数据
收藏浙江省数据知识产权登记平台2024-11-19 更新2024-11-20 收录
下载链接:
https://www.zjip.org.cn/home/announce/trends/86232
下载链接
链接失效反馈官方服务:
资源简介:
采集生菜水培的空气湿温度、光照、二氧化碳、气压等数据,对于精准调控水培条件、优化生长环境至关重要。这些数据综合反映了生菜生长空间的空气质量、光照资源及微气候状况,是实施智能化管理的重要依据。通过分析这些数据,种植者可以及时调整水培系统的通风、光照及营养液供给策略,确保生菜在最佳环境条件下生长,从而提升产量、改善品质,并减少因环境波动带来的生长风险。同时,这些数据也为生菜生长模型的建立与验证提供了宝贵资料,有助于进一步探索生菜生长的内在规律与外在环境因子的相互作用机制。1.数据采集:本系统通过空气温湿度传感器、PM传感器、光照传感器等物联网设备,结合4G/5G、Wi-Fi与有线网络,实时采集种植环境中的空气温湿度、PM2.5、PM10、光照、风速、风向、大气压等多维数据。 2.算法规则:系统采用环境参数评分算法,对环境数据进行评分。基于作物生长理想条件(如空气温湿度、PM2.5、PM10、光照、风速、风向、大气压等),并通过以下公式计算:环境参数评分=100-Σ(w_i×|当前值_i-理想值_i|/容差_i)其中,Σ表示对所有参数的累加,w_i是第i个参数的权重。当前值_i是第i个参数的实际测量值,理想值_i是第i个参数的理想值。容差_i是第i个参数的允许波动范围。权重、理想值和容差范围设定基于历史数据分析以及实际种植经验的确定。对作物生长影响较大的参数获得较高的权重。容差范围则考虑到环境因素的波动性,针对作物对不同环境变化的耐受性设定进行适当设定,环境参数偏离理想值越多,扣分越大,以空气温度为例,其权重为3,理想值设定为20,容差范围为±2,扣分计算如下:空气温度扣分=3×|26-20|/2=3×3=9。根据这些评分生成具体的环境优化方案。
Collecting data including air temperature and humidity, light, carbon dioxide, atmospheric pressure and other relevant parameters in hydroponic lettuce cultivation is critical for precisely regulating hydroponic conditions and optimizing the growth environment. These data comprehensively reflect the air quality, light resources and microclimate status of the lettuce growth space, serving as an important basis for implementing intelligent management. By analyzing these data, growers can timely adjust the ventilation, light and nutrient solution supply strategies of the hydroponic system, ensure that lettuce grows under optimal environmental conditions, thereby increasing yield, improving quality and reducing growth risks caused by environmental fluctuations. Meanwhile, these data also provide valuable resources for the establishment and verification of lettuce growth models, helping to further explore the interaction mechanism between the internal laws of lettuce growth and external environmental factors.
1. Data Collection: This system collects multi-dimensional data in real time from the planting environment via IoT devices such as air temperature and humidity sensors, PM sensors and light sensors, combined with 4G/5G, Wi-Fi and wired networks. The collected data includes air temperature and humidity, PM2.5, PM10, light, wind speed, wind direction, atmospheric pressure and other multidimensional parameters.
2. Algorithm Rules: The system adopts an environmental parameter scoring algorithm to evaluate environmental data. Based on the ideal growth conditions of crops (such as air temperature and humidity, PM2.5, PM10, light, wind speed, wind direction, atmospheric pressure, etc.), the score is calculated using the following formula:
Environmental Parameter Score = 100 - Σ(w_i × |Current Value_i - Ideal Value_i| / Tolerance_i)
Where Σ represents the summation over all parameters, w_i is the weight of the i-th parameter, Current Value_i is the actual measured value of the i-th parameter, Ideal Value_i is the ideal value of the i-th parameter, and Tolerance_i is the allowable fluctuation range of the i-th parameter. The weights, ideal values and tolerance ranges are determined based on historical data analysis and actual planting experience. Parameters with a greater impact on crop growth are assigned higher weights. The tolerance ranges are appropriately set considering the volatility of environmental factors and the crop's tolerance to different environmental changes. The greater the deviation of environmental parameters from the ideal values, the more points will be deducted. Taking air temperature as an example, its weight is 3, the ideal value is set to 20, and the tolerance range is ±2. The deduction for air temperature is calculated as follows:
Air Temperature Deduction = 3 × |26 - 20| / 2 = 3 × 3 = 9.
Specific environmental optimization plans are generated based on these scores.
提供机构:
兵峰(浙江)数字科技有限公司
创建时间:
2024-10-08
搜集汇总
数据集介绍
特点
山东省寿光市生菜种植环境分析数据包含多维环境参数,用于精准调控水培条件和优化生菜生长环境,每日更新,共801条记录。
以上内容由遇见数据集搜集并总结生成


