VisAnomBench
收藏资源简介:
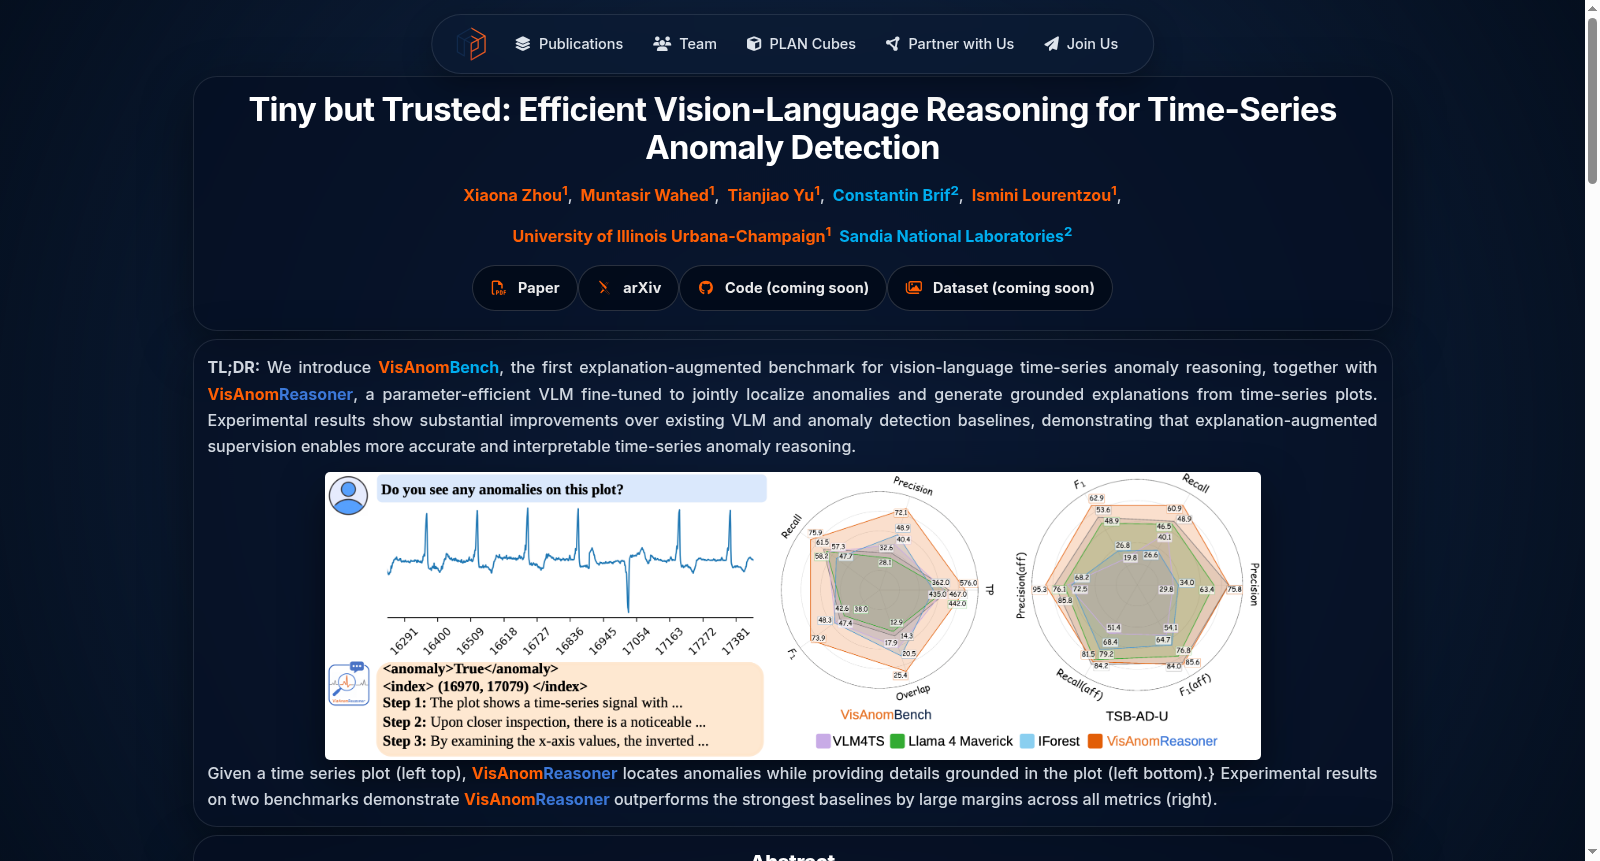
VisAnomBench是由伊利诺伊大学厄巴纳-香槟分校和桑迪亚国家实验室联合构建的视觉语言时序异常推理基准数据集。该数据集整合了KPI、GutenTAG、UCR-EGI和UCR-TSAD四个公开基准的3316条时间序列数据,涵盖工业监控、医疗诊断等多元领域,每条数据均包含可渲染的时序图像和基于多VLM筛选的高质量异常解释文本。数据集通过四阶段构建流程:首先对原始时序进行分段处理,然后转换为带坐标轴的图像表示,接着从四个通用视觉语言模型生成结构化输出,最后采用融合异常准确性、视觉可解释性、坐标轴一致性和逻辑清晰度的复合奖励机制筛选最优解释。该数据集旨在解决传统时序异常检测方法缺乏可解释性的问题,为视觉语言模型提供同时学习异常定位和视觉推理能力的监督信号,推动可解释人工智能在工业过程监控、医疗诊断等关键领域的应用。
VisAnomBench is a visual-language temporal anomaly reasoning benchmark dataset jointly constructed by the University of Illinois Urbana-Champaign and Sandia National Laboratories. This dataset integrates 3316 time series samples from four public benchmarks: KPI, GutenTAG, UCR-EGI and UCR-TSAD, covering multiple domains such as industrial monitoring and medical diagnosis. Each sample contains renderable temporal sequence images and high-quality anomaly explanation texts filtered by multiple VLMs. The dataset is built through a four-stage workflow: first, segmenting the original time series; second, converting them into image representations with coordinate axes; third, generating structured outputs via four general-purpose visual-language models; finally, selecting the optimal explanations using a composite reward mechanism that integrates anomaly accuracy, visual interpretability, coordinate axis consistency and logical clarity. This dataset aims to address the lack of interpretability in traditional time series anomaly detection methods, providing supervised signals for visual-language models to simultaneously learn anomaly localization and visual reasoning capabilities, and advancing the application of explainable artificial intelligence in key fields such as industrial process monitoring and medical diagnosis.
数据集概述
数据集名称:VisAnom Bench
所属项目:Tiny but Trusted: Efficient Vision-Language Reasoning for Time-Series Anomaly Detection
相关模型:VisAnom Reasoner(基于Qwen2.5-VL-3B和Qwen2.5-VL-7B的参数高效微调视觉语言模型)
构建来源
- 基于4个公开的时间序列异常检测数据集构建,涵盖多种领域和异常类型。
数据内容
- 为每个时间序列图提供:
- 异常区间标注(interval annotations)
- 时间上分步的解释(temporally grounded step-by-step explanations),与标注的异常对齐。
构建流程
- 将时间序列分割并渲染为图像。
- 从多个大型视觉语言模型(VLMs)中引出结构化推理轨迹。
- 使用一个结合异常定位准确性、视觉基础性、坐标轴感知性和清晰度的奖励机制,选择最高质量的解释。
数据规模
- 训练集:2,576 个时间序列样本
- 测试集:740 个时间序列样本(held-out)
应用目标
- 用于基于推理的异常检测模型的监督微调与评估。