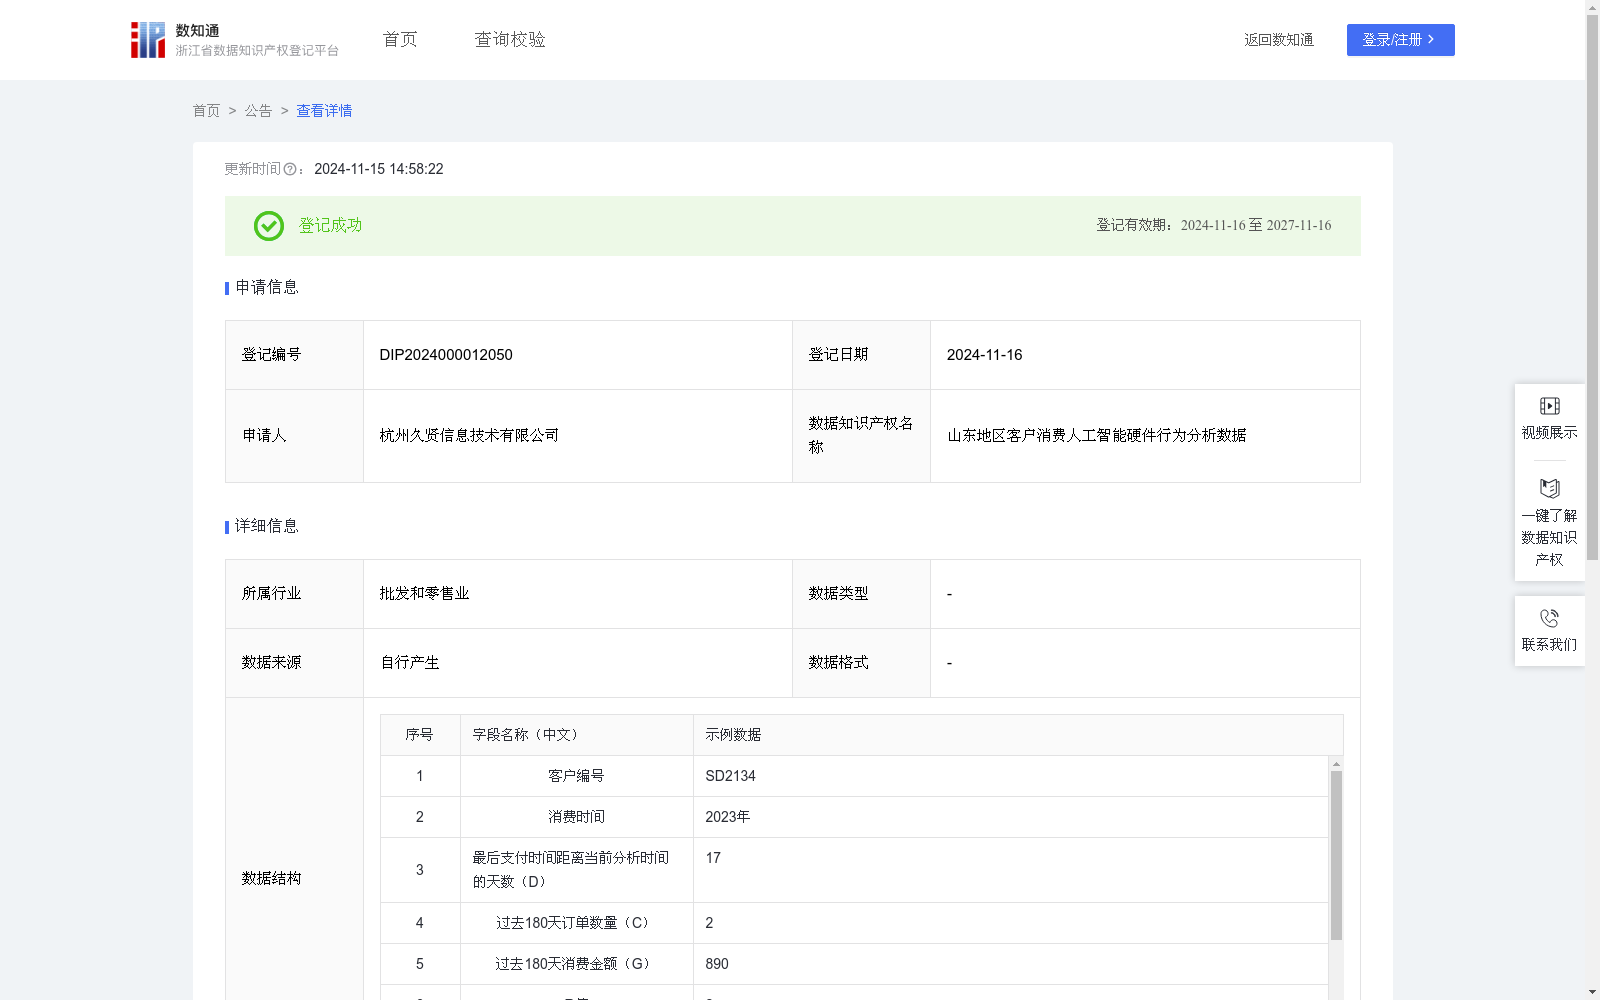
山东地区客户消费人工智能硬件行为分析数据
收藏浙江省数据知识产权登记平台2024-11-15 更新2024-11-16 收录
下载链接:
https://www.zjip.org.cn/home/announce/trends/85351
下载链接
链接失效反馈官方服务:
资源简介:
通过对山东地区消费人工智能硬件的用户进行分层,平台可以识别高价值用户,提供差异化的服务和营销策略,提高用户粘性和忠诚度。RFM模型还可以与其他用户属性数据结合,实现精细化的客户细分和精准营销。此外,通过分析用户RFM综合评分的变化趋势,平台可以预测用户生命周期价值,优化用户留存策略。RFM模型通过计算各个用户的最近一次消费时间(R)、消费频率(F)和消费金额(M)这三个维度。对于R值,根据用户最后支付时间距离当前分析时间的天数(D),划分为5个区间: 0≤D≤4为5分,4<D≤7 为4分,7<D≤15 为3分,15<D≤29为2分,D >29为1分;对于F值,根据用户在过去180天订单数量(C),划分为5个区间: 0≤C≤1为1分,2≤C≤5 为2分,6≤C≤11 为3分,12≤C≤19为4分,C≥20为5分;对于M值,根据用户在过去180天消费金额(G),划分为5个区间,G≥2000为5分,1200≤G<2000为4分,800≤G<1200为3分,400≤G<800为2分,0≤G<400为1分。RFM综合评分X=0.3*R+0.4*F+0.6*M,再根据RFM综合评分X对客户进行分类,0≤X<1为一般客户,1≤X<2为新客户,2≤X<4 为潜力深耕客户,4≤X<6为重要维系客户,X ≥6为高粘度客户,基于消费频次、消费金额等不同维度获得的聚类分组成果,对聚类分组数量和分组阀值、以及维度权重进行人为干预,使客户分类趋于合理。
By segmenting users who purchase AI hardware in Shandong Province, platforms can identify high-value users, deliver differentiated services and marketing strategies, and enhance user stickiness and loyalty. The RFM model can also be combined with other user attribute data to enable refined customer segmentation and targeted marketing. Additionally, by analyzing the changing trends of users' comprehensive RFM scores, platforms can predict customer lifetime value (CLV) and optimize user retention strategies. The RFM model calculates three core dimensions for each user: Recency (R, time elapsed since the last purchase), Frequency (F, total purchase frequency), and Monetary value (M, total consumption amount).
For the Recency (R) dimension, based on the number of days (D) between the user's last payment timestamp and the current analysis time, it is divided into 5 scoring intervals: 5 points for 0≤D≤4, 4 points for 4<D≤7, 3 points for 7<D≤15, 2 points for 15<D≤29, and 1 point for D>29. For the Frequency (F) dimension, based on the number of orders (C) placed by the user in the past 180 days, it is divided into 5 scoring intervals: 1 point for 0≤C≤1, 2 points for 2≤C≤5, 3 points for 6≤C≤11, 4 points for 12≤C≤19, and 5 points for C≥20. For the Monetary value (M) dimension, based on the total consumption amount (G) of the user in the past 180 days, it is divided into 5 scoring intervals: 5 points for G≥2000, 4 points for 1200≤G<2000, 3 points for 800≤G<1200, 2 points for 400≤G<800, and 1 point for 0≤G<400.
The comprehensive RFM score X is calculated as X = 0.3*R + 0.4*F + 0.6*M. Customers are then categorized based on their X score: general customers for 0≤X<1, new customers for 1≤X<2, potential deepening customers for 2≤X<4, key retention customers for 4≤X<6, and high-stickiness customers for X≥6. Manual adjustments to the number of clustering groups, grouping thresholds, and dimension weights can be conducted based on the clustering results obtained from dimensions including consumption frequency and consumption amount, to optimize the rationality of customer classification.
提供机构:
杭州久贤信息技术有限公司
创建时间:
2024-10-19
搜集汇总
数据集介绍
特点
该数据集包含2272条山东地区客户消费人工智能硬件的行为数据,每年更新一次。通过RFM模型对用户进行分层,帮助识别高价值用户并优化营销策略。
以上内容由遇见数据集搜集并总结生成


