教学-金融数据K线
收藏阿里云天池2026-05-29 更新2024-03-07 收录
下载链接:
https://tianchi.aliyun.com/dataset/165327
下载链接
链接失效反馈官方服务:
资源简介:
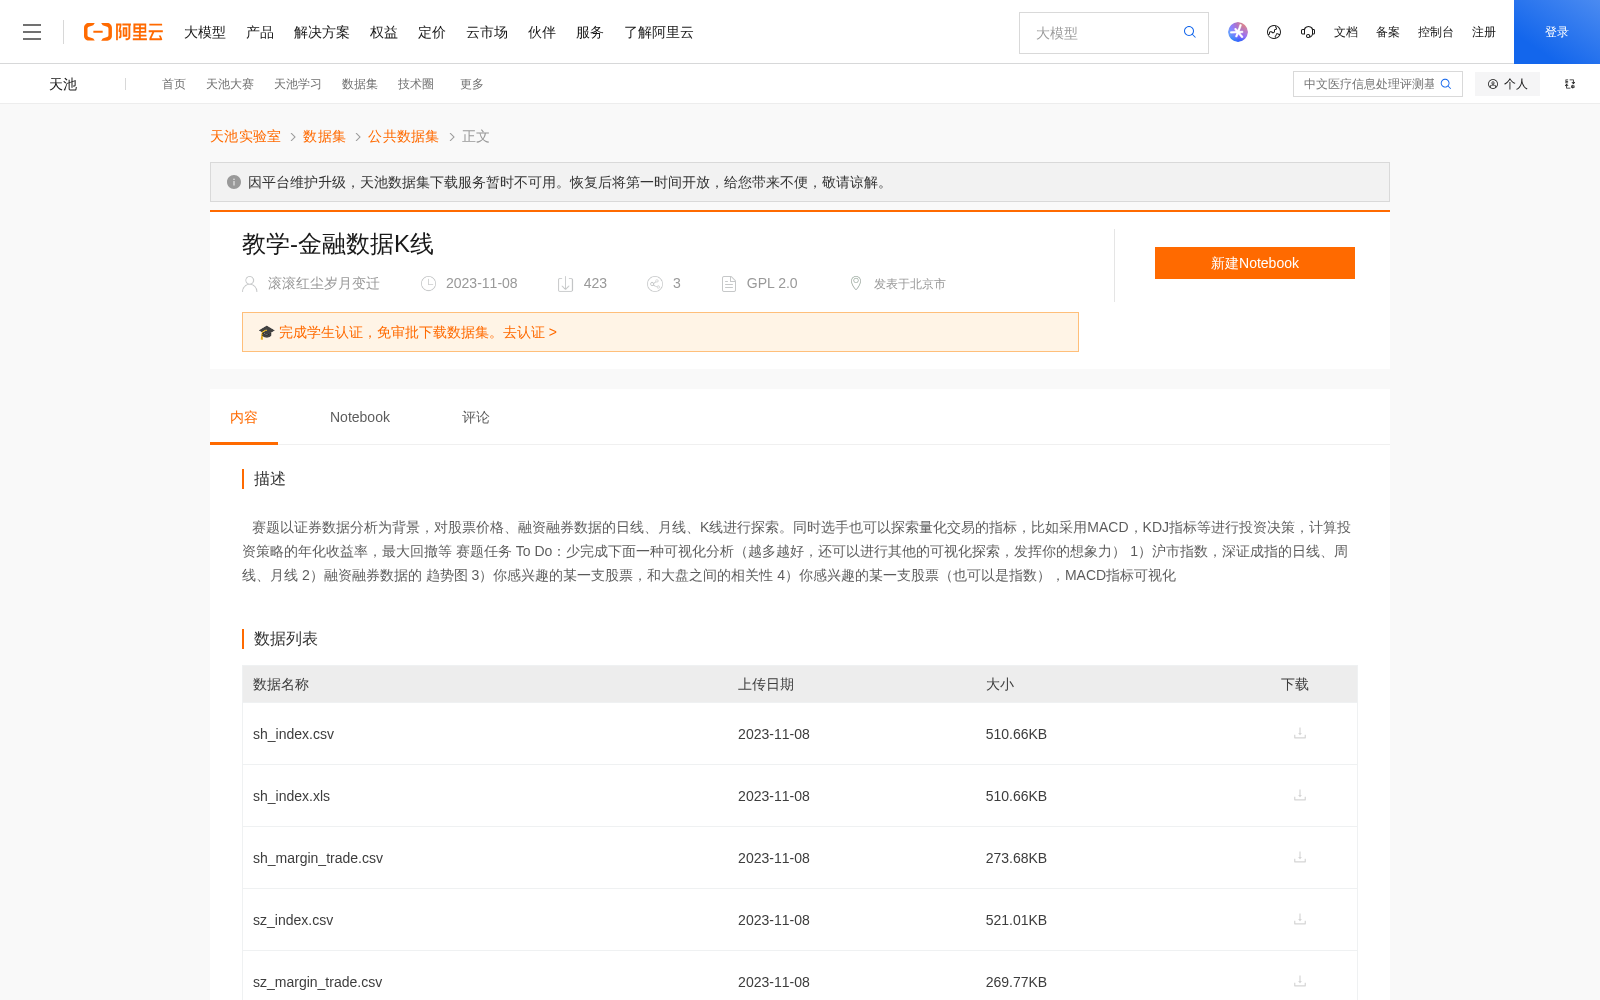
赛题以证券数据分析为背景,对股票价格、融资融券数据的日线、月线、K线进行探索。同时选手也可以探索量化交易的指标,比如采用MACD,KDJ指标等进行投资决策,计算投资策略的年化收益率,最大回撤等
赛题任务
To Do:少完成下面一种可视化分析(越多越好,还可以进行其他的可视化探索,发挥你的想象力)
1)沪市指数,深证成指的日线、周线、月线
2)融资融券数据的 趋势图
3)你感兴趣的某一支股票,和大盘之间的相关性
4)你感兴趣的某一支股票(也可以是指数),MACD指标可视化
This competition takes securities data analysis as its background, focusing on exploring daily, monthly, and K-line data of stock prices and margin trading. Participants may also explore quantitative trading indicators—such as MACD and KDJ—to formulate investment decisions, and calculate metrics including the annualized return rate and maximum drawdown of investment strategies.
### Competition Tasks
Complete at least one of the following visual analysis tasks. You may complete more for better results, and are encouraged to conduct additional visual explorations to unleash your creativity:
1. Daily, weekly and monthly line charts of the Shanghai Composite Index and Shenzhen Component Index
2. Trend charts of margin trading data
3. Correlation analysis between a specific stock of your interest and the broader market
4. Visualization of the MACD indicator for a specific stock (or index) of your interest
提供机构:
阿里云天池
创建时间:
2023-11-08
搜集汇总
数据集介绍
背景与挑战
背景概述
该数据集名为“教学-金融数据K线”,专注于证券数据分析,包含股票价格和融资融券数据的日线、月线及K线信息。它旨在支持可视化探索任务,例如分析沪市指数、深证成指的走势以及量化交易指标如MACD。
以上内容由遇见数据集搜集并总结生成


