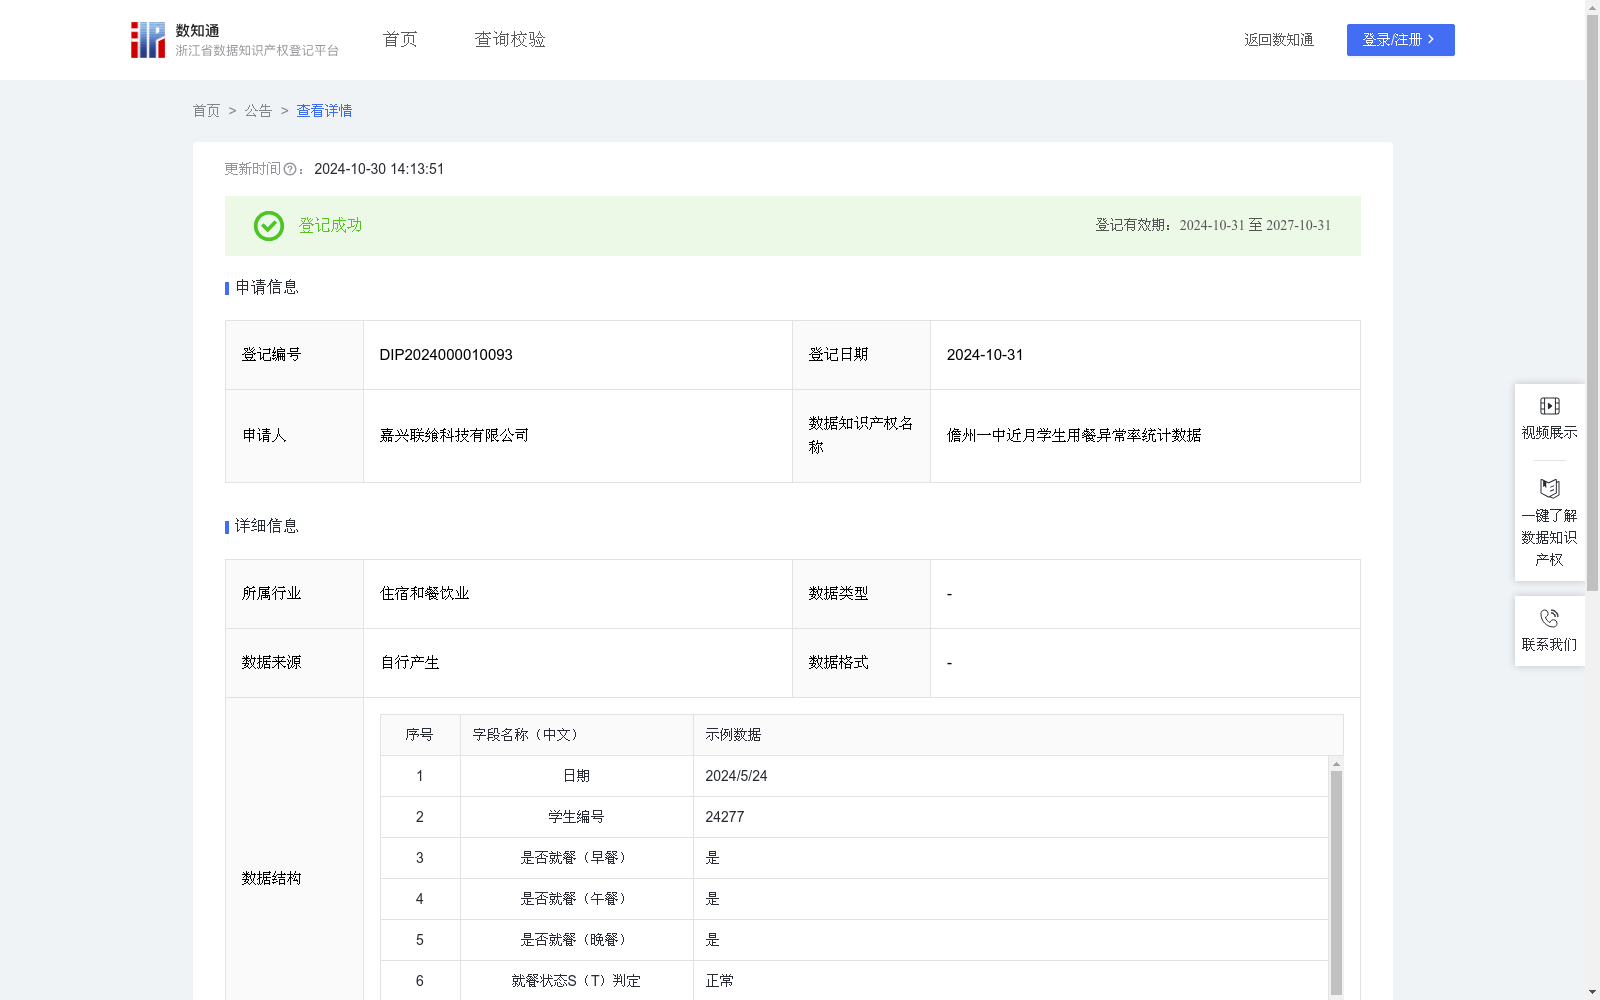
儋州一中近月学生用餐异常率统计数据
收藏资源简介:
本数据可用于学生每日就餐状态的监测,统计学生在食堂就餐时出现异常的频率,为学校提供食堂管理优化、学生健康监测、食品安全评估、预算和资源分配等辅助依据。若学生就餐状态为“正常”,则表明食堂管理良好、学生暂无健康问题;若学生就餐状态为“异常”,则表明食堂管理方面或者学生健康状况出现了问题。若学生近30日就餐状态异常率偏高,则学校可以对食堂管理、食品安全进行评估和优化,或是对异常率较高的学生进行重点关注,如了解其健康状况、家庭困难等。1.本数据通过以下方式获得: (1)数据采集:在经原始数据授权的前提下,从本单位运营的“5G智慧食安工业物联网数字化管理平台(SAAS)”上采集儋州市第一中学学生每日就餐数据,包括日期、学生编号、是否就餐(早餐)、是否就餐(午餐)、是否就餐(晚餐)。 (2)算法加工步骤: 第一步,对采集到的原始数据进行去重、脱敏; 第二步,对就餐状态S(T)进行判定:①若早餐、午餐、晚餐中出现一次“否”,则判定为“异常”;②若早餐、午餐、晚餐均为“是”,则判定为“正常”。 第三步,计算近30日学生就餐状态异常天数A; 第四步,计算近30日学生就餐状态异常率R:近30日学生就餐状态异常率R=近30日学生就餐状态异常天数A÷30×100%。 2.预估每年存证30000条,数量质量情况良好。
This dataset can be used to monitor the daily dining status of students, count the frequency of abnormal dining scenarios among students in the school cafeteria, and provide supporting bases for schools to optimize cafeteria management, monitor student health, assess food safety, and allocate budgets and resources. If a student's dining status is "normal", it means the cafeteria management is sound and the student has no current health issues; if the status is "abnormal", it indicates problems with either the cafeteria management or the student's health. For students with a relatively high abnormal dining status rate over the past 30 days, the school can evaluate and optimize cafeteria management and food safety, or provide targeted attention to such students, such as inquiring about their health conditions and family difficulties. 1. Data acquisition methods: (1) Data collection: With the authorization of the original data, daily dining data of students from Danzhou No.1 Middle School is collected from the "5G Smart Food Safety Industrial IoT Digital Management Platform (SAAS)" operated by our unit. The collected data includes date, student ID, whether the student had breakfast, whether they had lunch, and whether they had dinner. (2) Algorithm processing steps: Step 1: Deduplicate and desensitize the collected raw data; Step 2: Determine the dining status S(T): ① If "no" is marked for any of breakfast, lunch, or dinner, the status is judged as "abnormal"; ② If all three meals are marked as "yes", the status is judged as "normal". Step 3: Calculate the number of abnormal dining days A for the student over the past 30 days; Step 4: Calculate the abnormal dining rate R of the student over the past 30 days: R = (A / 30) × 100%. 2. It is estimated that 30,000 records will be archived annually, with good quantity and quality.