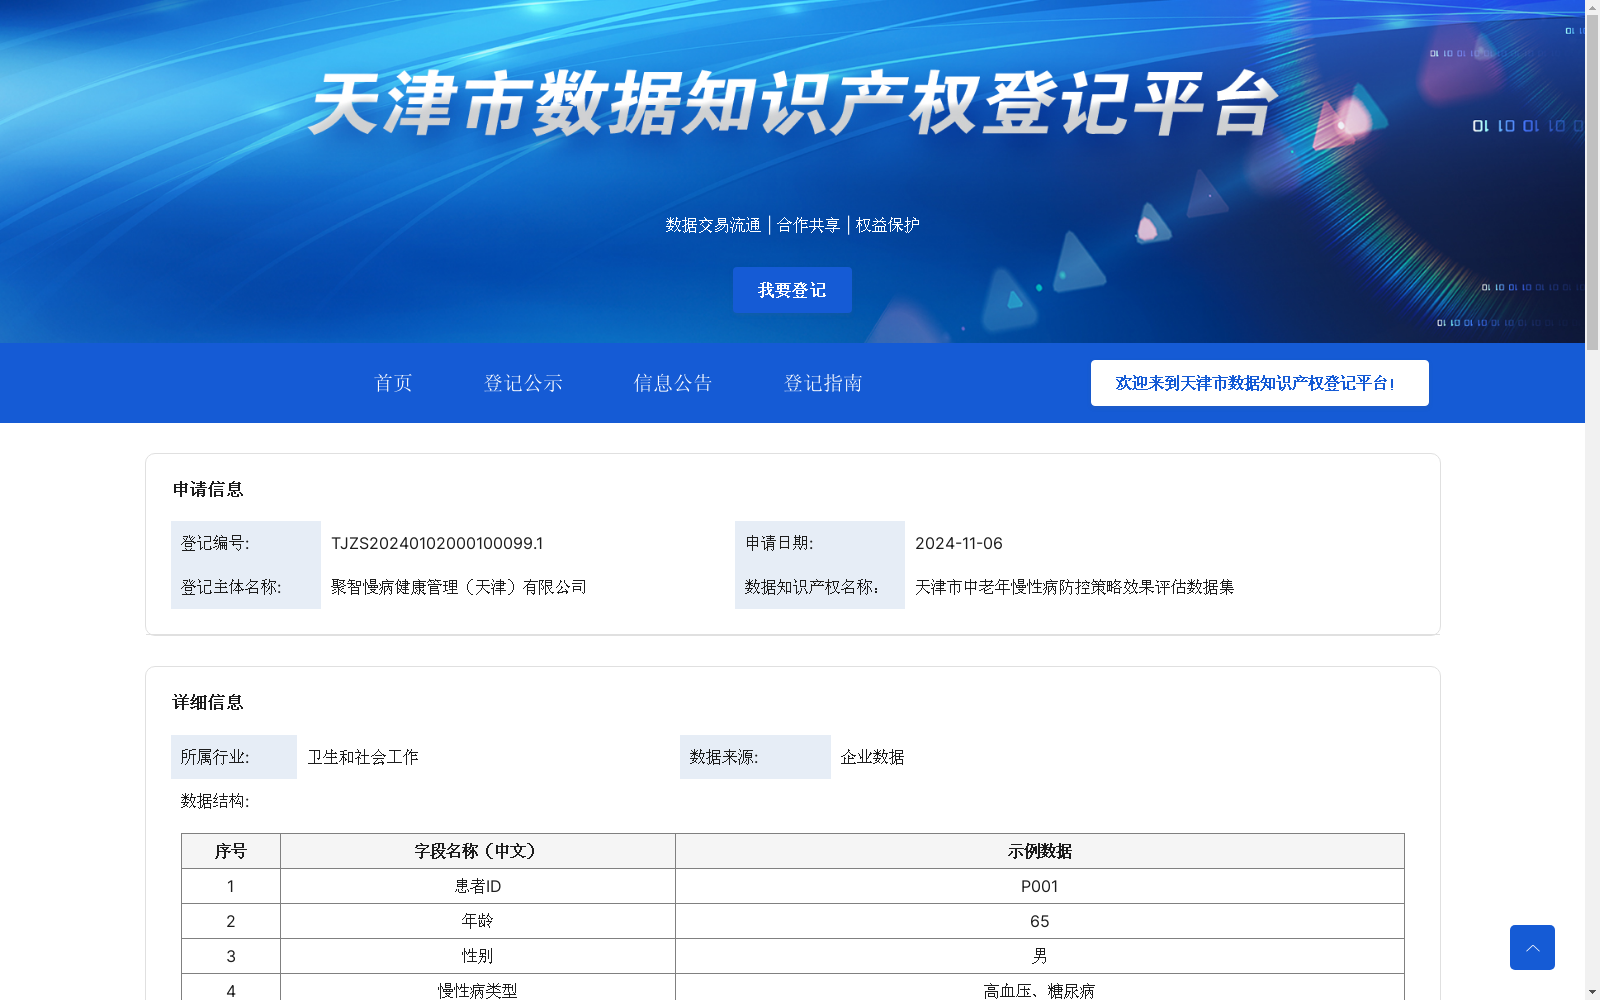
天津市中老年慢性病防控策略效果评估数据集
收藏天津市数据知识产权登记平台2024-11-11 更新2024-11-25 收录
下载链接:
https://dengji.tjippc.cn/xxgg_nr?id=93eabae1-230b-4d32-b831-ad47be88a622
下载链接
链接失效反馈官方服务:
资源简介:
1. 指标选取与数据收集规则
1.1 明确关键指标:
疾病发生率相关指标:包括特定慢性病的发病率、患病率。健康行为指标:如吸烟率、饮酒率、低盐低脂饮食的依从率、规律运动的参与率等。医疗资源利用指标:包括慢性病患者的就诊率、住院率、社区卫生服务的利用率、家庭医生签约率等。健康结局指标:如慢性病患者的并发症发生率、致残率、死亡率,以及患者的生活质量评分等。
规则:
设备数据通过API接口定期自动上传到云平台。
每个患者的所有数据点都与其唯一的患者ID关联。
数据采集频率由设备类型和患者病情决定,血压、血糖数据采集频率为每日一次,运动数据每小时采集一次。
1.2 数据收集的时间跨度和频率:一般需要收集至少 3至5 年的连续数据,以便观察防控策略实施后的长期效果。
2. 效果评估的算法模型
2.1 对比分析法:
前后对比:将防控策略实施前的中老年慢性病相关数据与实施后的数据进行对比。
组间对比:设置对照组和实验组,对照组为未实施防控策略或实施常规措施的人群,实验组为实施了特定防控策略的人群。
2.2 趋势分析法:分析慢性病相关指标在一段时间内的变化趋势。
2.3回归分析:建立回归模型,探究防控策略与慢性病相关指标之间的关系。
3.权重分配规则:根据不同指标对中老年慢性病防控的重要性,为各指标分配相应的权重。
4.4.不确定性分析规则:在效果评估过程中,考虑数据的不确定性和误差。
若体重超标,则建议减少高热量食物的摄入,增加蔬菜水果摄入。
4. 健康风险预测算法
4.1 高血压风险预测:
基于患者的血压数据、遗传因素、行为数据等,预测其未来高血压风险等级。
算法:
使用逻辑回归(Logistic Regression)算法,结合以下特征进行高血压风险预测:
年龄
既往血压数据(如平均收缩压、舒张压)
日常运动量(步数、运动频率)
饮食习惯(盐分摄入量)
遗传因素(家族病史)
通过训练模型,输出高血压风险等级(低、中、高),并在风险较高时给出预警。
4.2 糖尿病并发症风险预测:
基于患者的血糖控制情况、体重、饮食和运动数据,评估糖尿病并发症的风险。
1. Indicator Selection and Data Collection Rules
1.1 Clear Key Indicators:
Disease incidence-related indicators: including the incidence and prevalence rates of specific chronic diseases. Health behavior indicators: such as smoking rate, alcohol consumption rate, adherence rate to low-salt and low-fat diet, participation rate in regular exercise, etc. Medical resource utilization indicators: including the visit rate and hospitalization rate of chronic disease patients, utilization rate of community health services, signing rate of family doctor services, etc. Health outcome indicators: such as complication incidence rate, disability rate, mortality rate of chronic disease patients, as well as patients' quality of life scores, etc.
Rules: Equipment data is automatically uploaded to the cloud platform at regular intervals via API interfaces. All data points of each patient are associated with their unique patient ID. The data collection frequency is determined by the device type and the patient's condition: blood pressure and blood glucose data are collected once daily, while exercise data is collected once per hour.
1.2 Time Span and Frequency of Data Collection: Continuous data collection for at least 3 to 5 years is generally required to observe the long-term effects of prevention and control strategies after implementation.
2. Algorithmic Models for Effect Evaluation
2.1 Comparative Analysis Method:
Before-and-after comparison: Compare data related to chronic diseases among middle-aged and elderly populations before and after the implementation of prevention and control strategies.
Inter-group comparison: Set up a control group and an experimental group. The control group refers to the population that does not implement prevention and control strategies or adopts conventional measures, while the experimental group refers to the population that implements specific prevention and control strategies.
2.2 Trend Analysis Method: Analyze the changing trends of chronic disease-related indicators over a period of time.
2.3 Regression Analysis: Establish regression models to explore the relationship between prevention and control strategies and chronic disease-related indicators.
3. Weight Allocation Rules: Allocate corresponding weights to each indicator based on their importance in the prevention and control of middle-aged and elderly chronic diseases.
4.4 Uncertainty Analysis Rules: Consider data uncertainty and errors during the effect evaluation process. If body weight exceeds the standard, it is recommended to reduce the intake of high-calorie foods and increase the consumption of fruits and vegetables.
4. Health Risk Prediction Algorithms
4.1 Hypertension Risk Prediction: Predict the future hypertension risk level of patients based on their blood pressure data, genetic factors, behavioral data, etc.
Algorithm: Use the Logistic Regression algorithm, combined with the following features for hypertension risk prediction:
- Age
- Past blood pressure data (e.g., average systolic blood pressure, diastolic blood pressure)
- Daily exercise volume (steps, exercise frequency)
- Dietary habits (salt intake)
- Genetic factors (family medical history)
After training the model, it will output the hypertension risk level (low, medium, high) and issue an early warning when the risk is high.
4.2 Diabetes Complication Risk Prediction: Assess the risk of diabetes complications based on the patient's blood glucose control status, weight, diet and exercise data.
提供机构:
聚智慢病健康管理(天津)有限公司
创建时间:
2024-11-06
搜集汇总
数据集介绍
特点
该数据集包含天津市中老年慢性病患者的健康数据,用于评估防控策略效果和优化医疗资源配置,适用于健康教育与促进、疾病筛查等场景。
以上内容由遇见数据集搜集并总结生成


