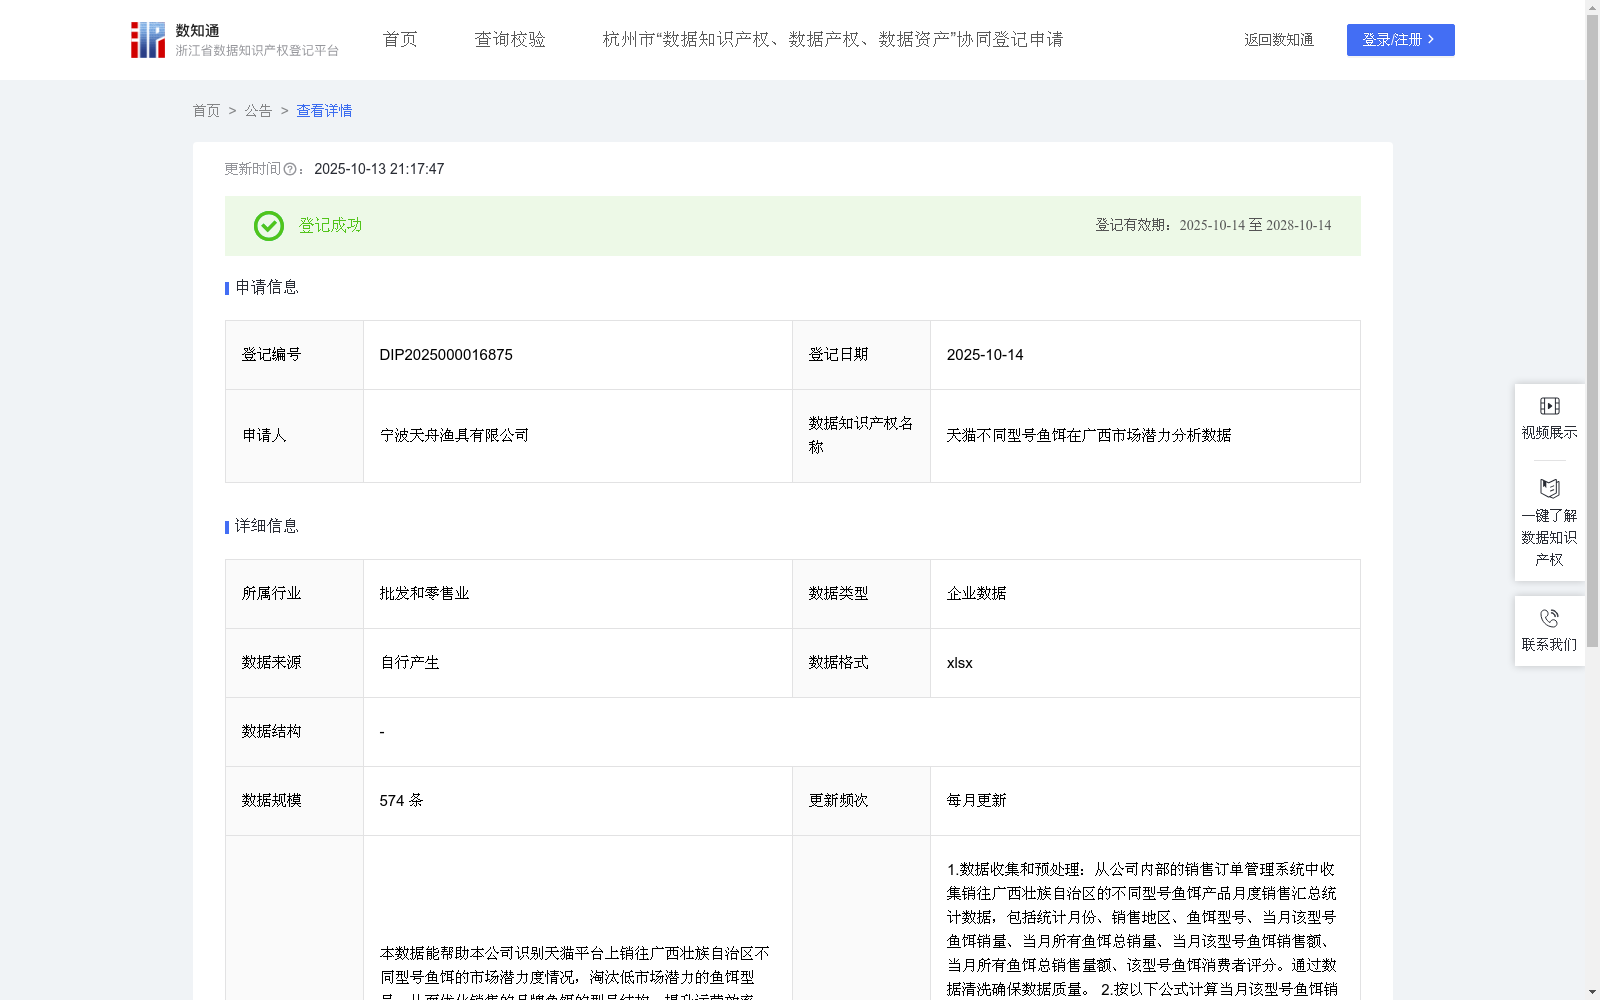
天猫不同型号鱼饵在广西市场潜力分析数据
收藏资源简介:
本数据能帮助本公司识别天猫平台上销往广西壮族自治区不同型号鱼饵的市场潜力度情况,淘汰低市场潜力的鱼饵型号,从而优化销售的品牌鱼饵的型号结构,提升运营效率,增强顾客满意度,提升复购率;通过将广告资源集中在市场潜力指数高的鱼饵型号上,提高广告效果,提升营销投资回报率(ROI)。 同样,本数据有利于广西壮族自治区其他品牌鱼饵销售商或者线下渔具店分析比较不同型号鱼饵在广西壮族自治区的市场潜力指数和潜力指数趋势,针对性地优化或改进自己的商品库,使销售的鱼饵更迎合市场的需求。此外,本数据也可为广西壮族自治区鱼饵行业的市场分析师和投资者提供分析支持和市场洞察。1.数据收集和预处理:从公司内部的销售订单管理系统中收集销往广西壮族自治区的不同型号鱼饵产品月度销售汇总统计数据,包括统计月份、销售地区、鱼饵型号、当月该型号鱼饵销量、当月所有鱼饵总销量、当月该型号鱼饵销售额、当月所有鱼饵总销售量额、该型号鱼饵消费者评分。通过数据清洗确保数据质量。 2.按以下公式计算当月该型号鱼饵销量占比:当月该型号鱼饵销量占比=当月该型号鱼饵销量/当月所有鱼饵总销量*100%; 3.按以下公式计算当月该型号鱼饵销售额占比:当月该型号鱼饵销售额占比=当月该型号鱼饵销售额/当月所有鱼饵总销售额*100% 4.按以下公式构建该型号鱼饵月度市场潜力指数:该型号鱼饵月度市场潜力指数=W1×当月该型号鱼饵销量占比+W2×当月该型号鱼饵销售额占比+W3×(该型号鱼饵消费者评分/5),其中W1、W2、W3是权重系数,W1+W2+W3=1。 5.趋势识别:使用ARIMA(自回归积分滑动平均)模型(一种用于分析按时间顺序排列的数据点,以识别趋势、周期性和其他模式的统计模型)进行时间序列分析,基于该型号鱼饵的历史市场潜力指数数据,识别该型号鱼饵的市场潜力指数趋势。
This dataset enables our company to evaluate the market potential of various fishing lure models sold on the Tmall platform to the Guangxi Zhuang Autonomous Region, eliminate low-potential lure models, thereby optimizing the product portfolio of branded fishing lures offered for sale, improving operational efficiency, enhancing customer satisfaction and increasing repurchase rates. By concentrating advertising resources on lure models with high market potential indices, this dataset can also improve advertising effectiveness and boost return on marketing investment (ROI). Similarly, this dataset helps other branded fishing lure sellers or offline fishing tackle shops in the Guangxi Zhuang Autonomous Region analyze and compare the market potential indices and their trends of different lure models in the region, so as to targeted optimize or refine their product inventory, making the sold lures better aligned with market demand. In addition, this dataset can also provide analytical support and actionable market insights for market analysts and investors in the fishing lure industry of the Guangxi Zhuang Autonomous Region. 1. Data Collection and Preprocessing: Collect monthly aggregated sales statistics of various fishing lure models destined for the Guangxi Zhuang Autonomous Region from the company's internal sales order management system. The collected data includes statistical month, sales region, lure model, monthly sales volume of the specific lure model, total monthly sales volume of all lures, monthly sales revenue of the specific lure model, total monthly sales revenue of all lures, and consumer ratings of the specific lure model. Ensure data quality through data cleaning. 2. Calculate the monthly sales volume proportion of a specific fishing lure model using the following formula: Monthly sales volume proportion of the lure model = (Monthly sales volume of the lure model / Total monthly sales volume of all lures) * 100% 3. Calculate the monthly sales revenue proportion of a specific fishing lure model using the following formula: Monthly sales revenue proportion of the lure model = (Monthly sales revenue of the lure model / Total monthly sales revenue of all lures) * 100% 4. Construct the monthly market potential index of a specific fishing lure model using the following formula: Monthly market potential index of the lure model = W1 × Monthly sales volume proportion of the lure model + W2 × Monthly sales revenue proportion of the lure model + W3 × (Consumer rating of the lure model / 5), where W1, W2, and W3 are weight coefficients that satisfy W1 + W2 + W3 = 1. 5. Trend Identification: Conduct time-series analysis using the ARIMA (AutoRegressive Integrated Moving Average) model, a statistical model used to analyze chronologically ordered data points to identify trends, periodicity and other patterns, to identify the trend of the market potential index for each specific fishing lure model based on its historical market potential index data.