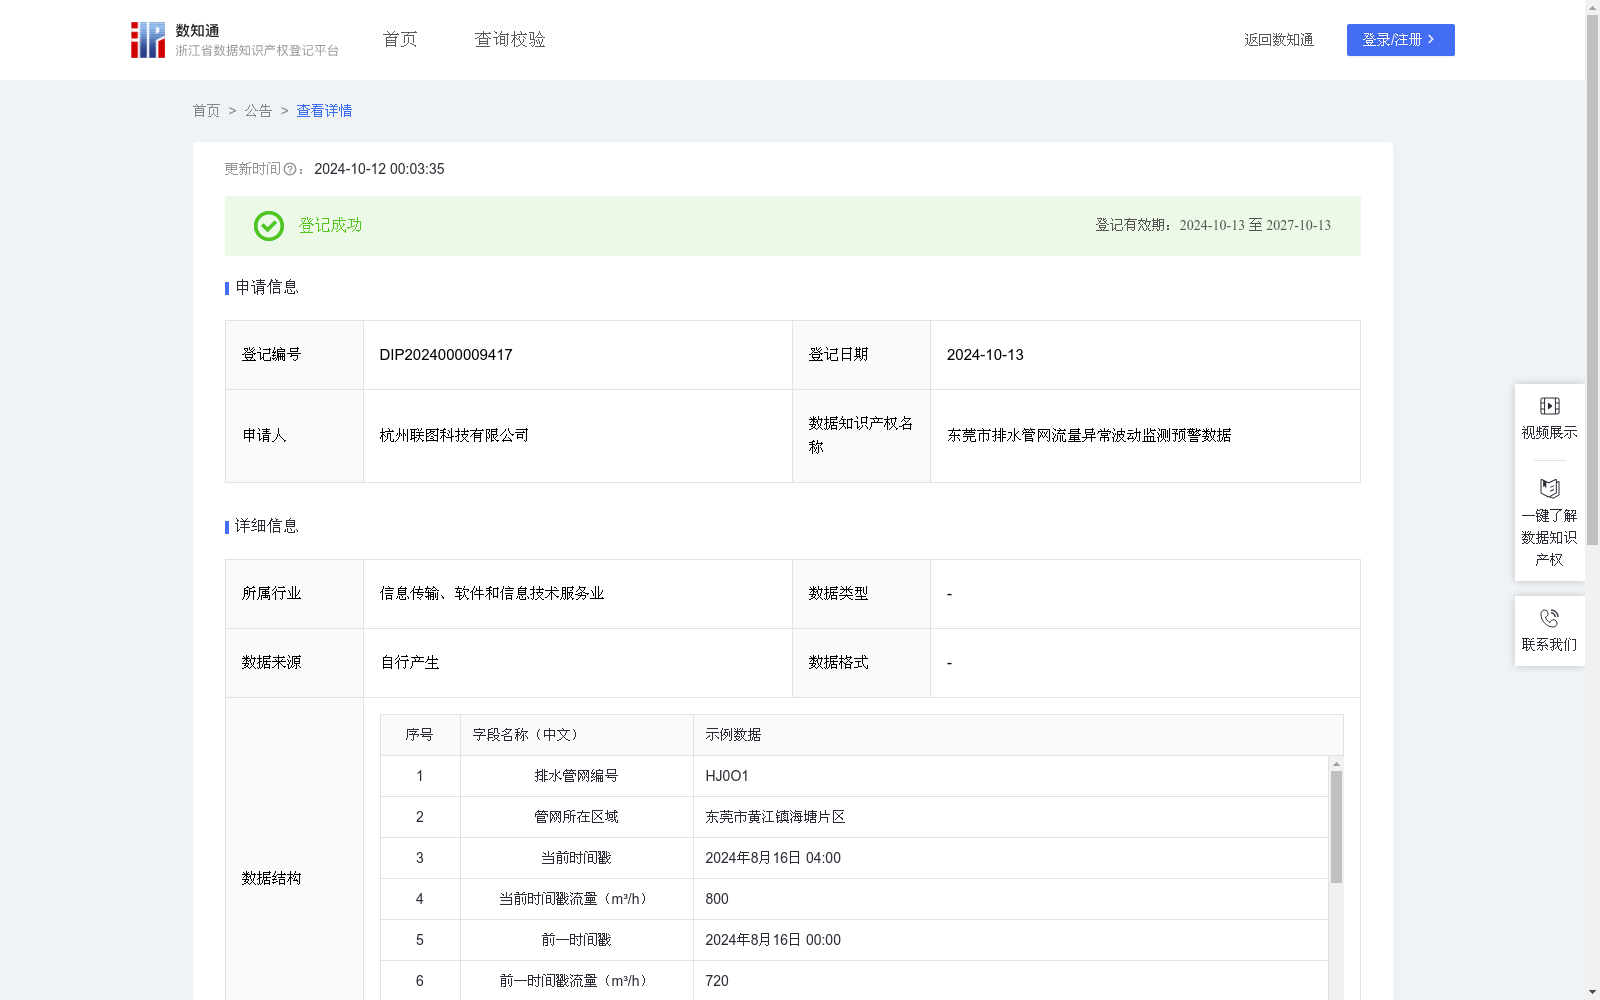
东莞市排水管网流量异常波动监测预警数据
收藏浙江省数据知识产权登记平台2024-10-12 更新2024-10-12 收录
下载链接:
https://www.zjip.org.cn/home/announce/trends/70081
下载链接
链接失效反馈官方服务:
资源简介:
(1)本数据有助于本公司及时发现异常波动,并发出预警,帮助监测点运营团队及时调查和发现管道问题(如泄漏、破裂等),减少损失和安全隐患。 (2)本数据有助于城市发展规划部门进一步统计分析排水管网流量异常情况,来评估现有排水设施的承载能力,对潜在的基础设施问题进行早期干预(如维修、保养或升级等)。 (3)本数据有助于环境保护机构利用本排水管网流量监测数据,结合其他数据如水质监测结果,评估排水系统对城市水体的影响。通过分析流量数据中的异常波动识别可能的污染源,如非法排污或污水处理厂的运行异常。这有助于及时采取措施,如发出整改通知或加强监管,从而保护和改善城市水环境。(1)数据收集和预处理:从公司内部排水管网流量监测平台抽取排水管网编号、管网所在区域、当前时间戳、当前时间戳流量、前一时间戳、前一时间戳流量、累计流量、监测次数。通过数据清洗去除无效或错误记录,确保数据质量。(2)特征计算:根据抽取的数据计算关键特征,包含流量变化率、平均流量和流量标准差:1.流量变化率=(当前时间戳流量-前一时间戳流量)/前一时间戳流量×100%;2.平均流量=累计流量/监测次数;3.标准流量差=sqrt((sum((流量i - 平均流量)^2) / n))(流量i是第i个时间戳监测的流量值,n是监测次数)(3)建立异常评分系统:使用Z-Score评分公式来评估流量数据点的异常程度。计算如下:Z-Score:Z=(当前时间戳流量值-平均流量)/流量标准差;4)根据历史经验设定Z-Score阈值和流量变化率阈值。(5)对于每个时间戳,按以下进行异常判定及预警生成:当流量变化率和Z-Score同时超过阈值,则认定异常,预警级别为高;当流量变化率或Z-Score超过阈值,则认定可能异常,预警级别为中;当流量变化率和Z-Score均未超过阈值,则认定正常,预警级别为低。
(1) This dataset enables our company to timely detect abnormal fluctuations and issue early warnings, assisting the operation teams at monitoring points to promptly investigate and identify pipeline issues such as leaks and ruptures, thereby reducing losses and safety hazards. (2) This dataset also supports urban development and planning departments in conducting statistical analysis of abnormal flow in drainage pipe networks, to evaluate the carrying capacity of existing drainage facilities and implement early interventions for potential infrastructure issues such as maintenance, upkeep, or upgrades. (3) This dataset aids environmental protection agencies in assessing the impact of drainage systems on urban water bodies by leveraging drainage pipe network flow monitoring data in combination with other data such as water quality monitoring results. It can identify potential pollution sources, such as illegal sewage discharge or operational abnormalities of sewage treatment plants, by analyzing abnormal fluctuations in flow data. This enables timely implementation of corrective measures including issuing rectification notices or strengthening supervision, thereby protecting and improving the urban aquatic environment.
1. Data Collection and Preprocessing: Extract data including drainage pipe network ID, location of the pipe network, current timestamp, flow at current timestamp, previous timestamp, flow at previous timestamp, cumulative flow, and number of monitoring times from the company's internal drainage pipe network flow monitoring platform. Remove invalid or erroneous records via data cleaning to ensure data quality.
2. Feature Calculation: Calculate key features based on the extracted data, including flow change rate, average flow, and flow standard deviation:
1. Flow Change Rate = (Flow at Current Timestamp - Flow at Previous Timestamp) / Flow at Previous Timestamp × 100%;
2. Average Flow = Cumulative Flow / Number of Monitoring Times;
3. Flow Standard Deviation = sqrt( (sum((Flow_i - Average Flow)^2)) / n ), where Flow_i refers to the flow value monitored at the i-th timestamp, and n is the total number of monitoring times.
3. Establishment of Anomaly Scoring System: Use the Z-Score formula to evaluate the anomaly degree of flow data points. The calculation is as follows:
Z-Score: Z = (Flow Value at Current Timestamp - Average Flow) / Flow Standard Deviation;
4. Set Z-Score threshold and flow change rate threshold based on historical experience.
5. For each timestamp, perform anomaly determination and early warning generation according to the following rules:
- If both the flow change rate and Z-Score exceed their respective thresholds, the data is identified as abnormal, with a high early warning level;
- If either the flow change rate or Z-Score exceeds its respective threshold, the data is identified as potentially abnormal, with a medium early warning level;
- If neither the flow change rate nor Z-Score exceeds their respective thresholds, the data is identified as normal, with a low early warning level.
提供机构:
杭州联图科技有限公司
创建时间:
2024-09-19
搜集汇总
数据集介绍
特点
该数据集记录了东莞市排水管网流量异常波动的监测预警数据,包含532条每日更新的记录,用于异常预警、城市规划和环境保护。数据结构详细,包含16个字段,并通过Z-Score评分系统进行异常判定。
以上内容由遇见数据集搜集并总结生成


