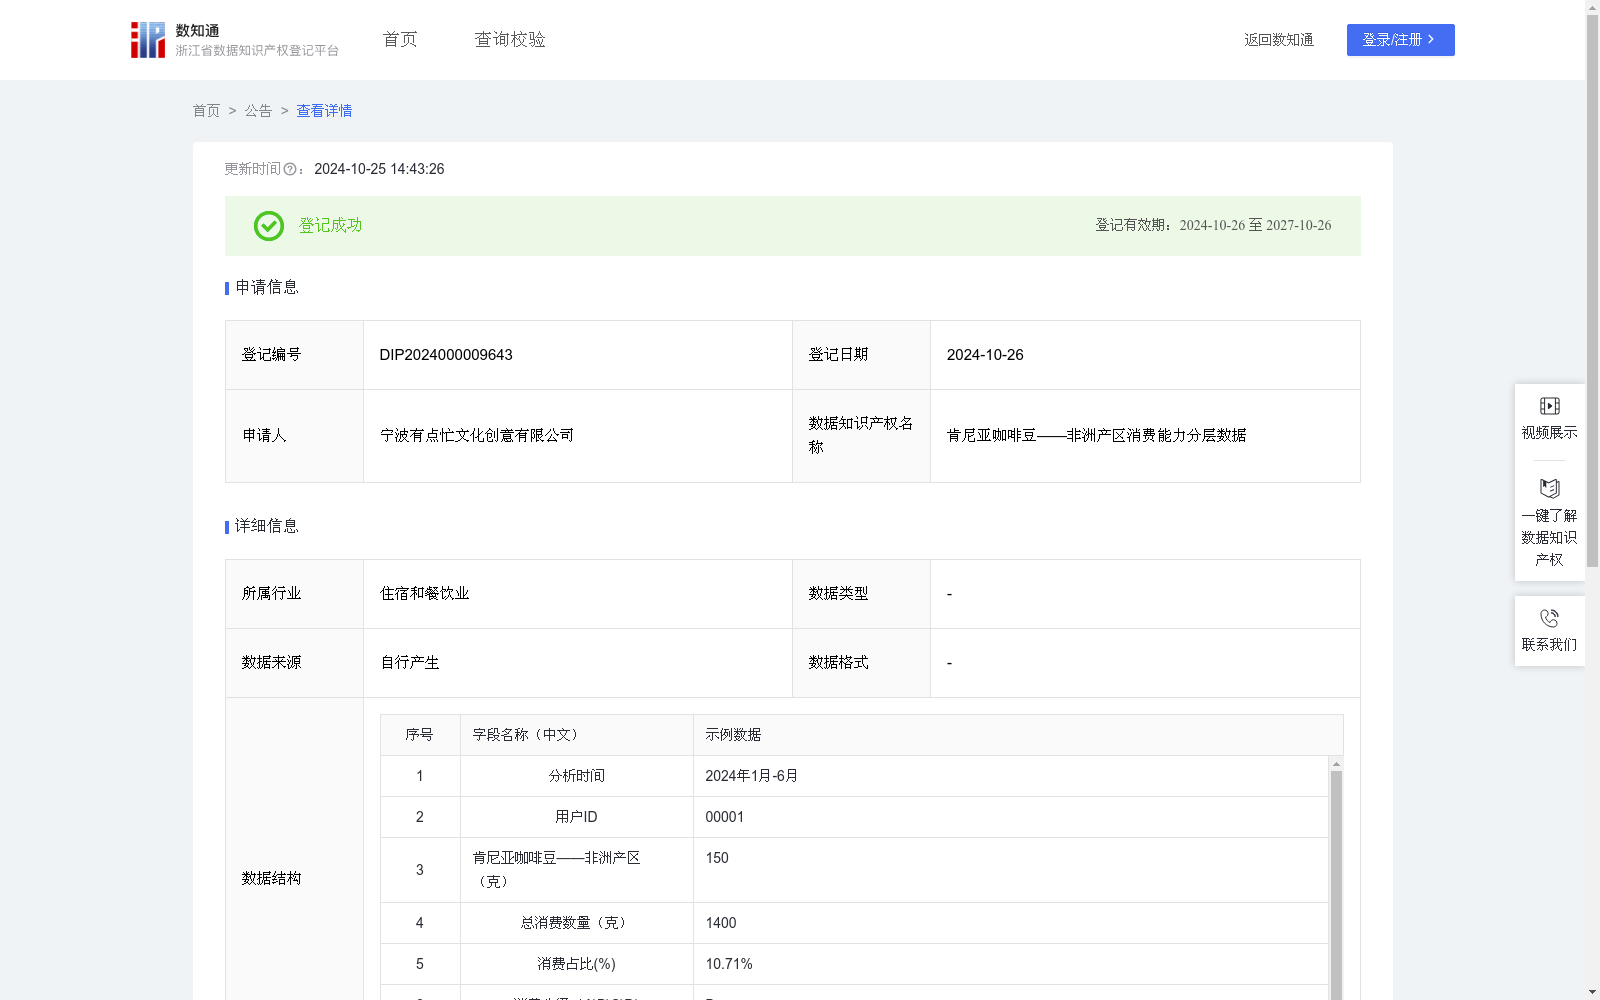
肯尼亚咖啡豆——非洲产区消费能力分层数据
收藏资源简介:
本数据基于咖啡店经营中顾客消费能力统计分层数据,通过采集咖啡门店消费咖啡店数量,品种等数据,了解区域内智慧园区的消费者对咖啡豆品种、品质等的需求状况,映射出各种咖啡店的受欢迎程度和市场认知度,为供货商、品牌方以及饮品从业者提供了有力的数据支撑,指导其精准定位营销方向,优化内容策略,定制高效推广计划,进一步增强市场竞争力和品牌影响力。应用场景广泛,通过充分利用这些数据资源,可以更好地理解区域范围用户咖啡需求,优化产品和服务,提升市场竞争力。1、数据采集:从自营咖啡店的运营管理系统采集用户消费数据,统计分析肯尼亚咖啡豆——非洲产区消费能力分层数据,通过对历史下单用户画像建立,对用户进行标签制定,定位用户消费级别,可以为咖啡店消费者广告营销策略提供数据支持,如推出适合消费层级的咖啡豆产品及定制化服务。2、数据计算:首先对敏感信息进行加密处理,对数据进行加工、脱敏、筛选、统计、分析。消费占比(%)=肯尼亚咖啡豆——非洲产区(克)/总消费数量(克)*100%。3、用户消费能力运用ABCD分类法,对消费占比≥18%的,给予“A类”用户分级;消费占比≥8%且<18%的,给予“B类”用户分级;消费占比≥2%且<8%区间的,给予“C类”用户分级;消费占比<2%区间的,给予“D类”用户分级,消费能力从A-D依次降低,A级为最高消费分级。4、经过统计、筛选得到综合分析结果,为企业管理者和政策制定者在经营中进行营销战略制定和市场指导。
This dataset is developed based on stratified statistical data of customer spending power in coffee shop operations. By collecting data such as transaction volume and coffee varieties in coffee shops, it aims to understand the demands of consumers in regional smart parks for coffee bean varieties, quality and other aspects, and reflect the popularity and market awareness of various coffee shops. This provides solid data support for suppliers, brand owners and beverage practitioners, guiding them to accurately position their marketing directions, optimize content strategies, develop efficient promotion plans, and further enhance their market competitiveness and brand influence. This dataset has wide application scenarios. By making full use of these data resources, stakeholders can better understand regional coffee consumer demands, optimize products and services, and improve market competitiveness. 1. Data Collection: Customer consumption data is collected from the operation management systems of self-operated coffee shops. Stratified data on spending power for Kenyan coffee beans from the African production region is statistically analyzed. By establishing profiles of historical order users and formulating user tags, the spending tiers of users can be identified, providing data support for advertising and marketing strategies of coffee shop consumers, such as launching coffee bean products and customized services tailored to different spending tiers. 2. Data Calculation: First, sensitive information is encrypted, and the data is processed, anonymized, filtered, statistically analyzed and evaluated. The formula for consumption proportion is: Consumption proportion (%) = (Kenyan coffee beans from African production region (g)) / Total consumption volume (g) * 100%. 3. User Spending Power Classification: The ABCD classification method is adopted. Users with a consumption proportion of ≥18% are classified as "Class A"; those with 8% ≤ consumption proportion <18% are classified as "Class B"; those with 2% ≤ consumption proportion <8% are classified as "Class C"; and those with consumption proportion <2% are classified as "Class D". Spending power decreases sequentially from Class A to Class D, with Class A being the highest spending tier. 4. Comprehensive analysis results obtained through statistics and screening can provide data support for enterprise managers and policy makers to formulate marketing strategies and guide market operations.