dp-bench
收藏魔搭社区2025-11-27 更新2024-11-02 收录
下载链接:
https://modelscope.cn/datasets/AI-ModelScope/dp-bench
下载链接
链接失效反馈官方服务:
资源简介:
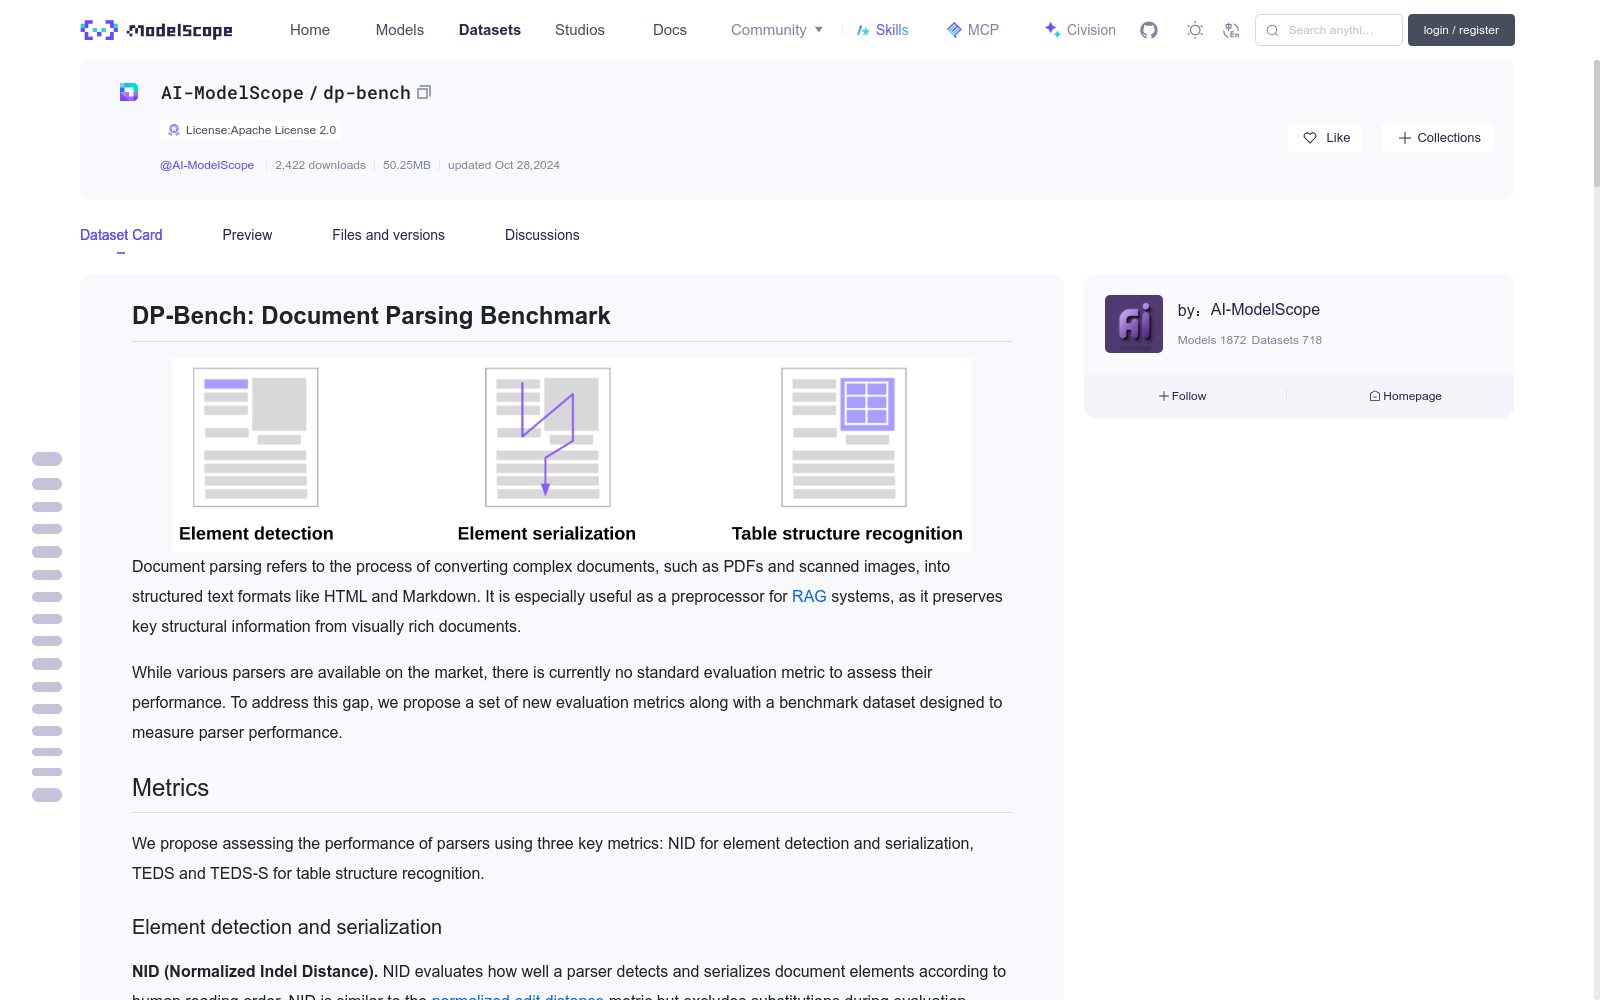
# **DP-Bench: Document Parsing Benchmark**
<div align="center">
<img src="https://cdn-uploads.huggingface.co/production/uploads/6524ab1e27d1f3d84ad07705/Q7CC2z4CAJzZ4-CGaSnBO.png" width="800px">
</div>
Document parsing refers to the process of converting complex documents, such as PDFs and scanned images, into structured text formats like HTML and Markdown.
It is especially useful as a preprocessor for [RAG](https://en.wikipedia.org/wiki/Retrieval-augmented_generation) systems, as it preserves key structural information from visually rich documents.
While various parsers are available on the market, there is currently no standard evaluation metric to assess their performance.
To address this gap, we propose a set of new evaluation metrics along with a benchmark dataset designed to measure parser performance.
## Metrics
We propose assessing the performance of parsers using three key metrics:
NID for element detection and serialization, TEDS and TEDS-S for table structure recognition.
### Element detection and serialization
**NID (Normalized Indel Distance).**
NID evaluates how well a parser detects and serializes document elements according to human reading order.
NID is similar to the [normalized edit distance](https://en.wikipedia.org/wiki/Levenshtein_distance) metric but excludes substitutions during evaluation, making it more sensitive to length differences between strings.
The NID metric is computed as follows:
$$
NID = 1 - \frac{\text{distance}}{\text{len(reference)} + \text{len(prediction)}}
$$
The normalized distance in the equation measures the similarity between the reference and predicted text, with values ranging from 0 to 1, where 0 represents perfect alignment and 1 denotes complete dissimilarity.
Here, the predicted text is compared against the reference text to determine how many character-level insertions and deletions are needed to match it.
A higher NID score reflects better performance in both recognizing and ordering the text within the document's detected layout regions.
### Table structure recognition
Tables are one of the most complex elements in documents, often presenting both structural and content-related challenges.
Yet, during NID evaluation, table elements (as well as figures and charts) are excluded, allowing the metric to focus on text elements such as paragraphs, headings, indexes, and footnotes. To specifically evaluate table structure and content extraction, we use the [TEDS](https://arxiv.org/abs/1911.10683) and [TEDS-S](https://arxiv.org/abs/1911.10683) metrics.
The [traditional metric](https://ieeexplore.ieee.org/document/1227792) fails to account for the hierarchical nature of tables (rows, columns, cells), but TEDS/TEDS-S measures the similarity between the predicted and ground-truth tables by comparing both structural layout and content, offering a more comprehensive evaluation.
**TEDS (Tree Edit Distance-based Similarity).**
The TEDS metric is computed as follows:
$$
TEDS(T_a, T_b) = 1 - \frac{EditDist(T_a, T_b)}{\max(|T_a|, |T_b|)}
$$
The equation evaluates the similarity between two tables by modeling them as tree structures \\(T_a\\) and \\(T_b\\).
This metric evaluates how accurately the table structure is predicted, including the content of each cell.
A higher TEDS score indicates better overall performance in capturing both the table structure and the content of each cell.
**TEDS-S (Tree Edit Distance-based Similarity-Struct).**
TEDS-S stands for Tree Edit Distance-based Similarity-Struct, measuring the structural similarity between the predicted and reference tables.
While the metric formulation is identical to TEDS, it uses modified tree representations, denoted as \\(T_a'\\) and \\(T_b'\\), where the nodes correspond solely to the table structure, omitting the content of each cell.
This allows TEDS-S to concentrate on assessing the structural similarity of the tables, such as row and column alignment, without being influenced by the contents within the cells.
## Benchmark dataset
### Document sources
The benchmark dataset is gathered from three sources: 90 samples from the Library of Congress; 90 samples from Open Educational Resources;
and 20 samples from Upstage's internal documents.
Together, these sources provide a broad and specialized range of information.
<div style="max-width: 500px; width: 100%; overflow-x: auto; margin: 0 auto;">
| Sources | Count|
|:---------------------------|:----:|
| Library of Congress | 90 |
| Open educational resources | 90 |
| Upstage | 20 |
</div>
### Layout elements
While works like [ReadingBank](https://github.com/doc-analysis/ReadingBank) often focus solely on text conversion in document parsing, we have taken a more detailed approach by dividing the document into specific elements, with a particular emphasis on table performance.
This benchmark dataset was created by extracting pages with various layout elements from multiple types of documents.
The layout elements consist of 12 element types: **Table, Paragraph, Figure, Chart, Header, Footer, Caption, Equation, Heading1, List, Index, Footnote**.
This diverse set of layout elements ensures that our evaluation covers a wide range of document structures and complexities, providing a comprehensive assessment of document parsing capabilities.
Note that only Heading1 is included among various heading sizes because it represents the main structural divisions in most documents, serving as the primary section title.
This high-level segmentation is sufficient for assessing the core structure without adding unnecessary complexity.
Detailed heading levels like Heading2 and Heading3 are omitted to keep the evaluation focused and manageable.
<div style="max-width: 500px; width: 100%; overflow-x: auto; margin: 0 auto;">
| Category | Count |
|:-----------|------:|
| Paragraph | 804 |
| Heading1 | 194 |
| Footer | 168 |
| Caption | 154 |
| Header | 101 |
| List | 91 |
| Chart | 67 |
| Footnote | 63 |
| Equation | 58 |
| Figure | 57 |
| Table | 55 |
| Index | 10 |
</div>
### Dataset format
The dataset is in JSON format, representing elements extracted from a PDF file, with each element defined by its position, layout class, and content.
The **category** field represents various layout classes, including but not limited to text regions, headings, footers, captions, tables, and more.
The **content** field has three options: the **text** field contains text-based content, **html** represents layout regions where equations are in LaTeX and tables in HTML, and **markdown** distinguishes between regions like Heading1 and other text-based regions such as paragraphs, captions, and footers.
Each element includes coordinates (x, y), a unique ID, and the page number it appears on.
The dataset’s structure supports flexible representation of layout classes and content formats for document parsing.
```
{
"01030000000001.pdf": {
"elements": [
{
"coordinates": [
{
"x": 170.9176246670229,
"y": 102.3493458064781
},
{
"x": 208.5023846755278,
"y": 102.3493458064781
},
{
"x": 208.5023846755278,
"y": 120.6598699131856
},
{
"x": 170.9176246670229,
"y": 120.6598699131856
}
],
"category": "Header",
"id": 0,
"page": 1,
"content": {
"text": "314",
"html": "",
"markdown": ""
}
},
...
...
```
<div style="max-width: 800px; width: 100%; overflow-x: auto; margin: 0 auto;">
### Document domains
| Domain | Subdomain | Count |
|:-------------------------------------|:------------------------|------:|
| Social Sciences | Economics | 26 |
| Social Sciences | Political Science | 18 |
| Social Sciences | Sociology | 16 |
| Social Sciences | Law | 12 |
| Social Sciences | Cultural Anthropology | 11 |
| Social Sciences | Education | 8 |
| Social Sciences | Psychology | 4 |
| Natural Sciences | Environmental Science | 26 |
| Natural Sciences | Biology | 10 |
| Natural Sciences | Astronomy | 4 |
| Technology | Technology | 33 |
| Mathematics and Information Sciences | Mathematics | 13 |
| Mathematics and Information Sciences | Informatics | 9 |
| Mathematics and Information Sciences | Computer Science | 8 |
| Mathematics and Information Sciences | Statistics | 2 |
</div>
## Usage
### Setup
Before setting up the environment, **make sure to [install Git LFS](https://git-lfs.com/)**, which is required for handling large files.
Once installed, you can clone the repository and install the necessary dependencies by running the following commands:
```
$ git clone https://huggingface.co/datasets/upstage/dp-bench.git
$ cd dp-bench
$ pip install -r requirements.txt
```
The repository includes necessary scripts for inference and evaluation, as described in the following sections.
### Inference
We offer inference scripts that let you request results from various document parsing services.
For more details, refer to this [README](https://huggingface.co/datasets/upstage/dp-bench/blob/main/scripts/README.md).
### Evaluation
The benchmark dataset can be found in the `dataset` folder.
It contains a wide range of document layouts, from text-heavy pages to complex tables, enabling a thorough evaluation of the parser’s performance.
The dataset comes with annotations for layout elements such as paragraphs, headings, and tables.
The following options are required for evaluation:
- **`--ref_path`**: Specifies the path to the reference JSON file, predefined as `dataset/reference.json` for evaluation purposes.
- **`--pred_path`**: Indicates the path to the predicted JSON file. You can either use a sample result located in the `dataset/sample_results` folder, or generate your own by using the inference script provided in the `scripts` folder.
#### Element detection and serialization evaluation
This evaluation will compute the NID metric to assess how accurately the text in the document is recognized considering the structure and order of the document layout.
To evaluate the document layout results, run the following command:
```
$ python evaluate.py \
--ref_path <path to the reference json file> \
--pred_path <path to the predicted json file> \
--mode layout
```
#### Table structure recognition evaluation
This will compute TEDS-S (structural accuracy) and TEDS (structural and textual accuracy).
To evaluate table recognition performance, use the following command:
```
$ python evaluate.py \
--ref_path <path to the reference json file> \
--pred_path <path to the predicted json file> \
--mode table
```
# Leaderboard
<div style="max-width: 800px; width: 100%; overflow-x: auto; margin: 0 auto;">
| Source | Request date | TEDS ↑ | TEDS-S ↑ | NID ↑ | Avg. Time (secs) ↓ |
|:---------------------|:------------:|-----------:|----------:|------------:|------------:|
| upstage | 2024-10-24 | **93.48** | **94.16** | **97.02** | **3.79** |
| aws | 2024-10-24 | 88.05 | 90.79 | 96.71 | 14.47 |
| llamaparse | 2024-10-24 | 74.57 | 76.34 | 92.82 | 4.14 |
| unstructured | 2024-10-24 | 65.56 | 70.00 | 91.18 | 13.14 |
| google | 2024-10-24 | 66.13 | 71.58 | 90.86 | 5.85 |
| microsoft | 2024-10-24 | 87.19 | 89.75 | 87.69 | 4.44 |
</div>
# **DP-Bench:文档解析基准测试集**
<div align="center">
<img src="https://cdn-uploads.huggingface.co/production/uploads/6524ab1e27d1f3d84ad07705/Q7CC2z4CAJzZ4-CGaSnBO.png" width="800px">
</div>
文档解析指将PDF、扫描图像等复杂文档转换为HTML、Markdown等结构化文本格式的过程。其作为检索增强生成(Retrieval-Augmented Generation, RAG)系统的预处理工具尤为实用,可保留视觉丰富文档中的关键结构信息。
当前市场上虽已涌现多款文档解析器,但尚无标准评估指标用以衡量其性能。为填补这一空白,我们提出了一套全新的评估指标,以及用于评测解析器性能的基准数据集。
## 评估指标
我们提出采用三项核心指标评估解析器性能:用于元素检测与序列化的NID,以及用于表格结构识别的TEDS与TEDS-S。
### 元素检测与序列化
**归一化插入删除距离(Normalized Indel Distance, NID)**
NID评估解析器按照人类阅读顺序检测并序列化文档元素的能力。其与归一化编辑距离(Levenshtein距离)指标类似,但评估过程中排除替换操作,因此对字符串间的长度差异更为敏感。
NID指标的计算方式如下:
$$
NID = 1 - frac{ ext{distance}}{ ext{len(reference)} + ext{len(prediction)}}
$$
该公式中的归一化距离用于衡量参考文本与预测文本的相似度,取值范围为0至1:0代表完全对齐,1代表完全不相似。此处通过比较预测文本与参考文本,计算匹配所需的字符级插入与删除操作次数。NID分值越高,代表解析器在文档布局区域内识别文本并按序排列的性能越好。
### 表格结构识别
表格是文档中最复杂的元素之一,往往同时面临结构与内容相关的双重挑战。但在NID评估中,表格元素(以及图片、图表)会被排除,使得该指标可专注于段落、标题、索引、脚注等文本元素的评估。为专门评测表格结构与内容提取能力,我们采用了TEDS与TEDS-S指标。
传统指标无法兼顾表格的层级结构(行、列、单元格),而TEDS/TEDS-S通过将预测表格与真值表格建模为树结构并比较二者的结构布局与内容,实现了更全面的评估。
**基于树编辑距离的相似度(Tree Edit Distance-based Similarity, TEDS)**
TEDS指标的计算方式如下:
$$
TEDS(T_a, T_b) = 1 - frac{EditDist(T_a, T_b)}{max(|T_a|, |T_b|)}
$$
该公式通过将两张表格建模为树结构$T_a$与$T_b$,评估二者的相似度。该指标可评估表格结构预测的准确性,包括每个单元格的内容。TEDS分值越高,代表解析器在捕获表格结构与各单元格内容方面的综合性能越好。
**基于树编辑距离的结构相似度(Tree Edit Distance-based Similarity-Struct, TEDS-S)**
TEDS-S用于衡量预测表格与参考表格的结构相似度。尽管其公式与TEDS完全一致,但采用了修改后的树结构表示$T_a'$与$T_b'$,其中节点仅对应表格结构,忽略各单元格的内容。这使得TEDS-S可专注于评估表格的结构相似度(如行列对齐情况),不受单元格内内容的影响。
## 基准数据集
### 文档来源
本基准数据集来源于三个渠道:美国国会图书馆(Library of Congress)的90份样本、开放教育资源(Open Educational Resources)的90份样本,以及Upstage内部文档的20份样本。这些渠道共同提供了广泛且专业化的信息范围。
<div style="max-width: 500px; width: 100%; overflow-x: auto; margin: 0 auto;">
| 来源 | 数量 |
|:---------------------------|:----:|
| 美国国会图书馆 | 90 |
| 开放教育资源 | 90 |
| Upstage | 20 |
</div>
### 布局元素
现有研究如ReadingBank往往仅聚焦于文档解析中的文本转换,而本基准采用更精细化的划分方式,将文档拆分为特定元素类型,并重点关注表格性能。
本基准数据集通过从多种类型的文档中提取包含各类布局元素的页面构建而成。布局元素共包含12类:表格(Table)、段落(Paragraph)、图片(Figure)、图表(Chart)、页眉(Header)、页脚(Footer)、题注(Caption)、公式(Equation)、一级标题(Heading1)、列表(List)、索引(Index)、脚注(Footnote)。多样化的布局元素集合确保我们的评估覆盖了广泛的文档结构与复杂度,可全面评测文档解析能力。
请注意,在各类标题尺寸中仅包含一级标题(Heading1),因为其代表了大多数文档中的主要结构划分,作为核心章节标题。这种高层次的分段足以评估核心结构,无需增加不必要的复杂度。为保持评估的聚焦性与可管理性,二级、三级标题等更细致的标题层级被省略。
<div style="max-width: 500px; width: 100%; overflow-x: auto; margin: 0 auto;">
| 类别 | 数量 |
|:-----------|------:|
| 段落 | 804 |
| 一级标题 | 194 |
| 页脚 | 168 |
| 题注 | 154 |
| 页眉 | 101 |
| 列表 | 91 |
| 图表 | 67 |
| 脚注 | 63 |
| 公式 | 58 |
| 图片 | 57 |
| 表格 | 55 |
| 索引 | 10 |
</div>
### 数据集格式
本数据集采用JSON格式,代表从PDF文件中提取的元素,每个元素由其位置、布局类别与内容定义。**category**字段表示各类布局类别,包括但不限于文本区域、标题、页脚、题注、表格等。**content**字段包含三种选项:**text**字段存储文本类内容,**html**字段表示布局区域(其中公式采用LaTeX格式,表格采用HTML格式),**markdown**字段用于区分一级标题与段落、题注、脚注等其他文本区域。每个元素均包含坐标(x,y)、唯一ID以及所在页码。本数据集的结构支持灵活表示布局类别与内容格式,适配文档解析任务。
{
"01030000000001.pdf": {
"elements": [
{
"coordinates": [
{
"x": 170.9176246670229,
"y": 102.3493458064781
},
{
"x": 208.5023846755278,
"y": 102.3493458064781
},
{
"x": 208.5023846755278,
"y": 120.6598699131856
},
{
"x": 170.9176246670229,
"y": 120.6598699131856
}
],
"category": "Header",
"id": 0,
"page": 1,
"content": {
"text": "314",
"html": "",
"markdown": ""
}
},
...
...
<div style="max-width: 800px; width: 100%; overflow-x: auto; margin: 0 auto;">
### 文档领域
| 领域 | 子领域 | 数量 |
|:-------------------------------------|:------------------------|------:|
| 社会科学 | 经济学 | 26 |
| 社会科学 | 政治学 | 18 |
| 社会科学 | 社会学 | 16 |
| 社会科学 | 法学 | 12 |
| 社会科学 | 文化人类学 | 11 |
| 社会科学 | 教育 | 8 |
| 社会科学 | 心理学 | 4 |
| 自然科学 | 环境科学 | 26 |
| 自然科学 | 生物学 | 10 |
| 自然科学 | 天文学 | 4 |
| 技术 | 技术 | 33 |
| 数学与信息科学 | 数学 | 13 |
| 数学与信息科学 | 信息学 | 9 |
| 数学与信息科学 | 计算机科学 | 8 |
| 数学与信息科学 | 统计学 | 2 |
</div>
## 使用方法
### 环境搭建
在配置环境前,请务必安装Git大文件存储(Git LFS),其为处理大文件所必需。安装完成后,可通过以下命令克隆仓库并安装必要依赖:
$ git clone https://huggingface.co/datasets/upstage/dp-bench.git
$ cd dp-bench
$ pip install -r requirements.txt
本仓库包含推理与评估所需的脚本,详见后续章节。
### 推理
我们提供了推理脚本,可调用各类文档解析服务获取结果。详情请参阅该[README](https://huggingface.co/datasets/upstage/dp-bench/blob/main/scripts/README.md)。
### 评估
基准数据集存放在`dataset`文件夹中,包含从文本密集页面到复杂表格的各类文档布局,可全面评测解析器的性能。本数据集附带段落、标题、表格等布局元素的标注。
评估需以下必填参数:
- **`--ref_path`**:指定参考JSON文件的路径,评估时预定义为`dataset/reference.json`。
- **`--pred_path`**:指定预测结果JSON文件的路径。可使用`dataset/sample_results`文件夹中的示例结果,或通过`scripts`文件夹中的推理脚本生成自定义结果。
#### 元素检测与序列化评估
本评估将计算NID指标,用以评估解析器在考虑文档布局结构与顺序的前提下,识别文档文本的准确性。若要评估文档布局结果,请运行以下命令:
$ python evaluate.py
--ref_path <path to the reference json file>
--pred_path <path to the predicted json file>
--mode layout
#### 表格结构识别评估
本评估将计算TEDS-S(结构准确度)与TEDS(结构与文本准确度)。若要评估表格识别性能,请使用以下命令:
$ python evaluate.py
--ref_path <path to the reference json file>
--pred_path <path to the predicted json file>
--mode table
## 排行榜
<div style="max-width: 800px; width: 100%; overflow-x: auto; margin: 0 auto;">
| 来源 | 请求日期 | TEDS ↑ | TEDS-S ↑ | NID ↑ | 平均耗时(秒) ↓ |
|:---------------------|:------------:|-----------:|----------:|------------:|------------:|
| Upstage | 2024-10-24 | **93.48** | **94.16** | **97.02** | **3.79** |
| AWS | 2024-10-24 | 88.05 | 90.79 | 96.71 | 14.47 |
| LlamaParse | 2024-10-24 | 74.57 | 76.34 | 92.82 | 4.14 |
| Unstructured | 2024-10-24 | 65.56 | 70.00 | 91.18 | 13.14 |
| Google | 2024-10-24 | 66.13 | 71.58 | 90.86 | 5.85 |
| Microsoft | 2024-10-24 | 87.19 | 89.75 | 87.69 | 4.44 |
</div>
提供机构:
maas创建时间:
2024-10-28
搜集汇总
数据集介绍
背景与挑战
背景概述
DP-Bench是一个文档解析基准数据集,旨在评估解析器在复杂文档(如PDF和扫描图像)转换为结构化文本格式(如HTML和Markdown)时的性能。数据集包含来自图书馆、开放教育资源和内部文档的200个样本,涵盖12种布局元素和多个领域,并提供了NID、TEDS和TEDS-S三种评估指标。
以上内容由遇见数据集搜集并总结生成


