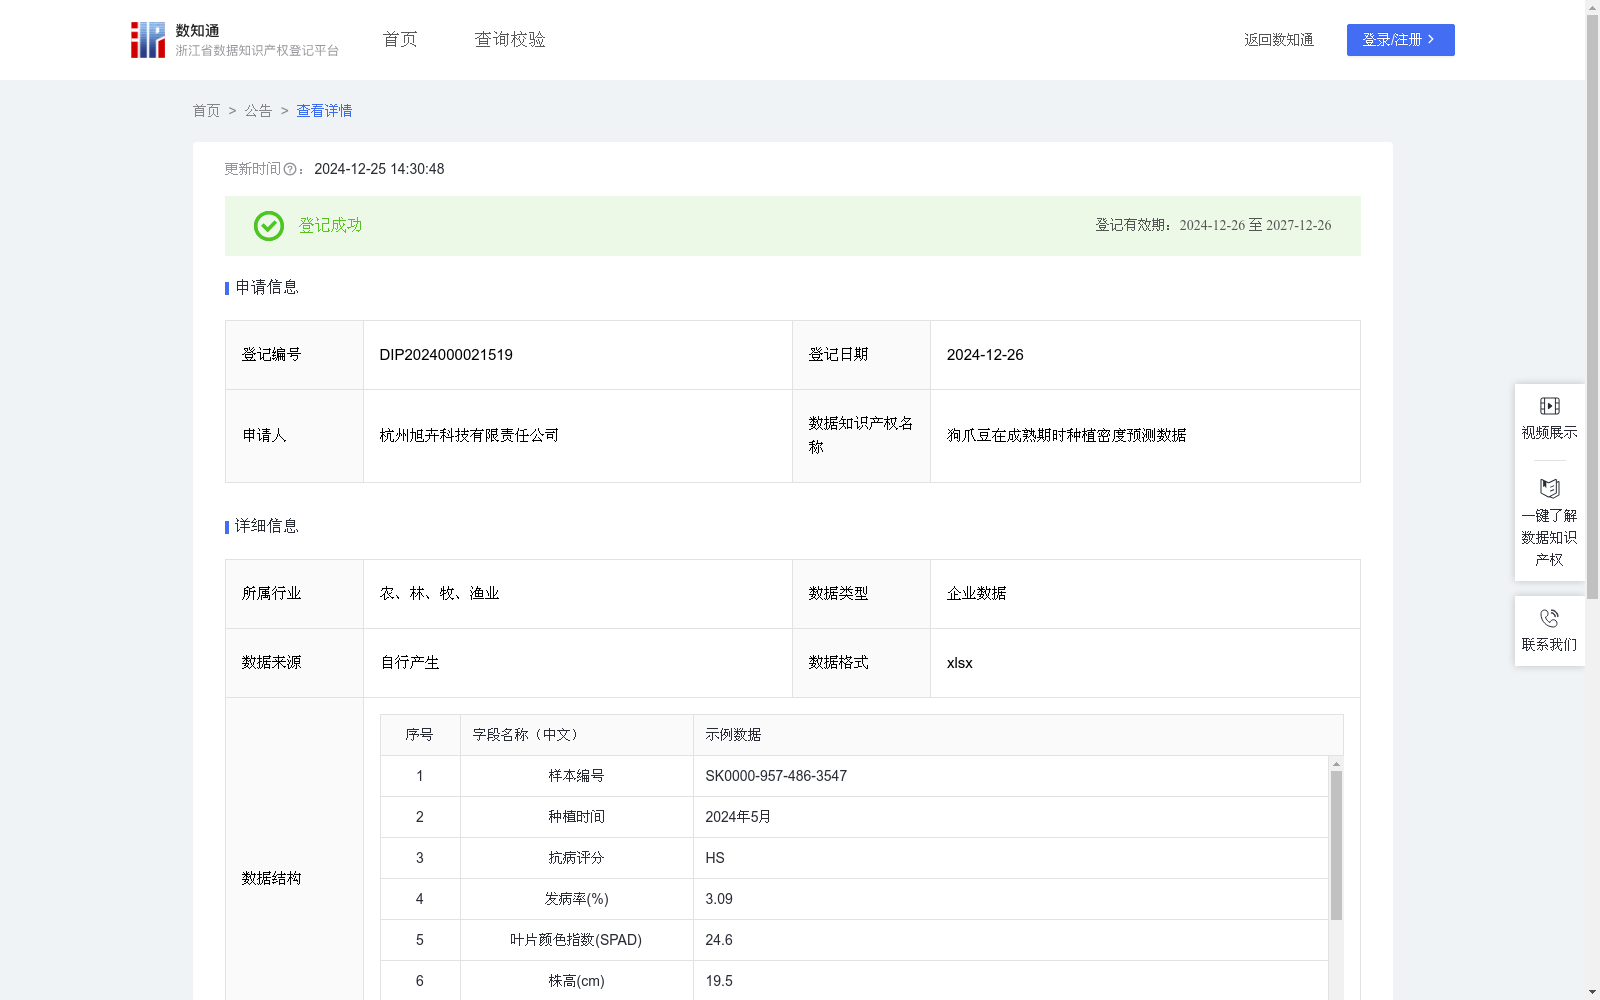
狗爪豆在成熟期时种植密度预测数据
收藏浙江省数据知识产权登记平台2024-12-25 更新2024-12-26 收录
下载链接:
https://www.zjip.org.cn/home/announce/trends/108466
下载链接
链接失效反馈官方服务:
资源简介:
狗爪豆在成熟期的种植密度直接影响作物的生长条件、病虫害发生率以及最终产量。合理预测狗爪豆在成熟期时种植密度,从而能够在分蘖期适时调整种植密度对于提高单位面积产量、优化资源使用及减少病虫害具有重要意义。该模型有效的解决了狗爪豆生长状况与种植密度之间的预测关系。通过调查采集狗爪豆在分蘖期的相关数据,并使用多元线性回归模型预测狗爪豆种植密度,该模型的输入量依次为抗病评分、发病率(%)、叶片颜色指数(SPAD)、株高(cm)、病虫害类型、生育期(天)、分蘖数,多元线性回归算法通过分析这些输入量与狗爪豆种植密度之间的线性关系,确定每个输入量相关的权重系数,使用深度学习框架构建模,模型通过最小二乘法等技术,根据输入的数据从而计算出狗爪豆种植密度预测值。在模型训练过程中,算法会利用最终在成熟期测得的狗爪豆种植密度实际值进行优化,调整上述的权重系数以最小化预测误差,因此上述每个权重系数在成熟期后,算法会根据实际值与预测值进行比较后再进行动态调整的。
The planting density of velvet bean (Mucuna pruriens) at the maturity stage directly affects crop growth conditions, pest and disease incidence, and final yield. Reasonably predicting the planting density of velvet bean at maturity and thus timely adjusting the planting density during the tillering stage is of great significance for improving yield per unit area, optimizing resource utilization, and reducing pests and diseases. This model effectively addresses the predictive relationship between the growth status of velvet bean and planting density. Relevant data of velvet bean during the tillering stage is collected through investigation, and a multiple linear regression model is used to predict the planting density of velvet bean. The input variables of this model are, in order: disease resistance score, disease incidence (%), leaf color index (SPAD), plant height (cm), pest and disease types, growth period (days), and tiller number. The multiple linear regression algorithm analyzes the linear relationship between these input variables and the planting density of velvet bean to determine the weight coefficients corresponding to each input variable. The model is constructed using a deep learning framework, and calculates the predicted value of velvet bean planting density from the input data through techniques such as the least squares method. During the model training process, the algorithm uses the actual measured planting density values of velvet bean at final maturity for optimization, adjusting the aforementioned weight coefficients to minimize prediction error. Therefore, each of the above weight coefficients will be dynamically adjusted after the maturity stage by comparing the actual values with the predicted values.
提供机构:
杭州旭卉科技有限责任公司
创建时间:
2024-12-05
搜集汇总
数据集介绍
以上内容由遇见数据集搜集并总结生成


