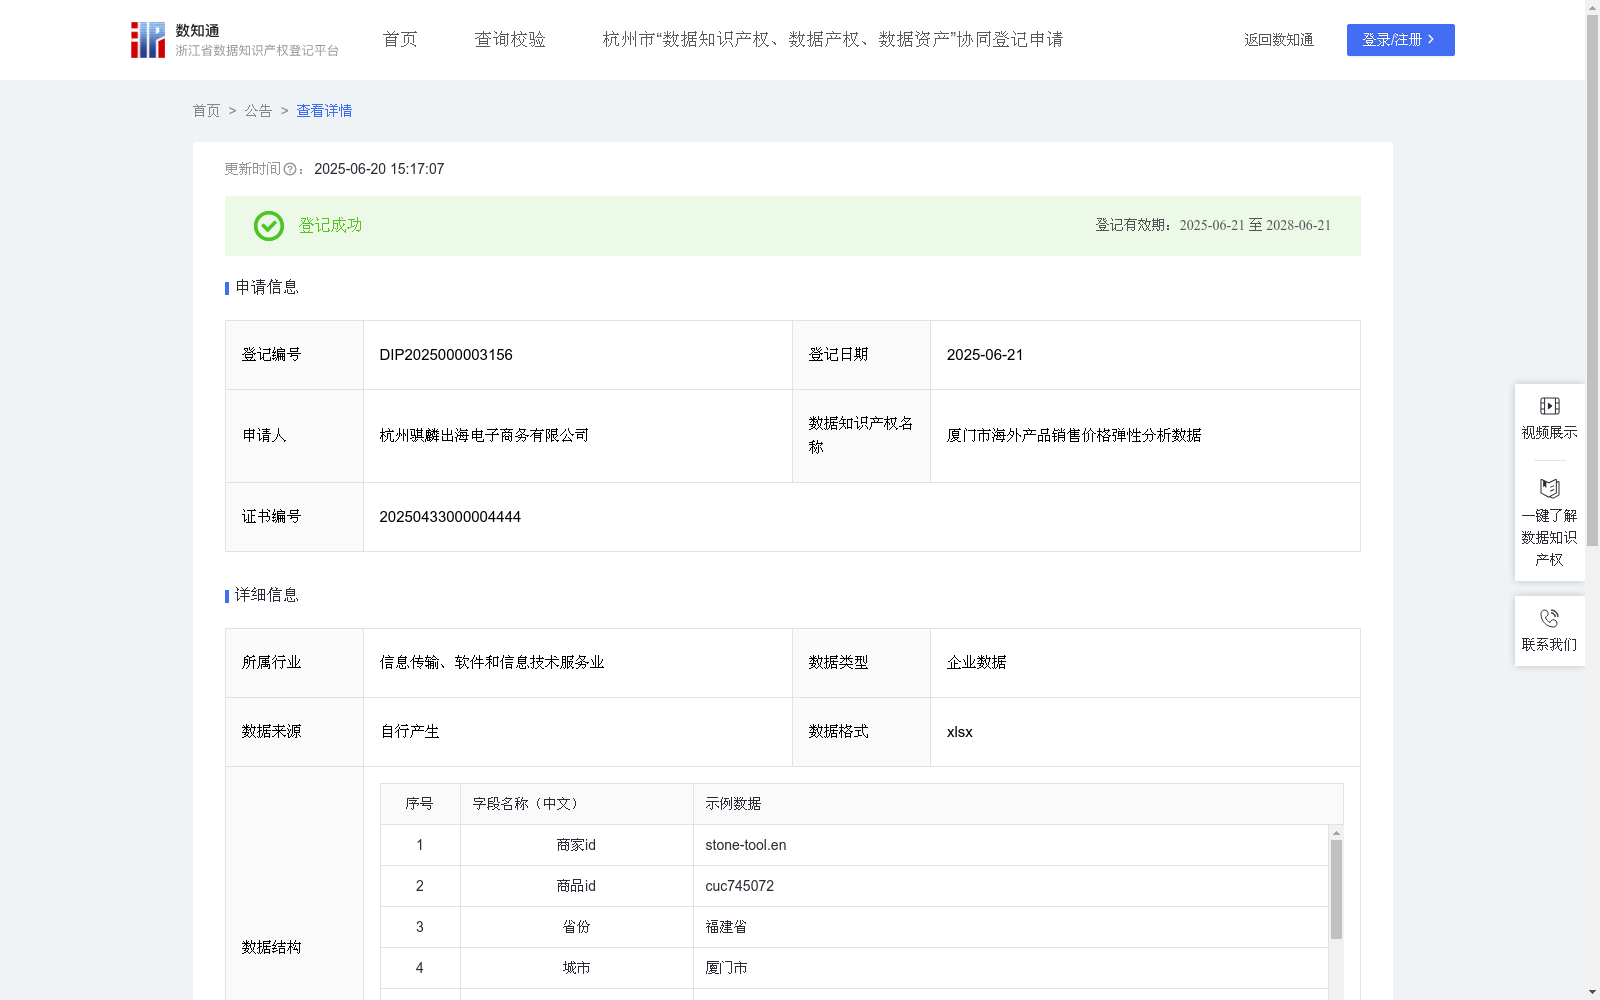
厦门市海外产品销售价格弹性分析数据
收藏资源简介:
为了更好了解厦门市跨境电商的海外市场需求情况,采集海外市场需求弹性数据进行计算,如果需求量变动的比例大于价格波动的比率,那么海外市场需求富有弹性,说明海外用户对于该品类商品价格变化的敏感成都大,弹性越大,需求对价格变化越敏感,本行业所有企业可以在该区域适当降低产品价格赖获得较多的收益。该项数据对本行业所有企业在该低于的市场营销决策有重要意义。1.数据采集:采集厦门市跨境商家所销售区域每个月的需求数据和价格数据,按照市级进行整理归纳,得到该海外销售产品的需求量变动数值和价格变化数值。 2.算法规则:对采集得到的数据按照如下公式进行计算:需求弹性系数=-(需求量同比变动值(个)/上月产品需求量(个)(Q))÷(价格同比变动值(美元)/上月产品价格(美元)(P)),得到需求弹性系数。公式中:Q表示上月产品的需求量,单位为个;P表示上月产品的价格,单位为美元;△Q表示需求量同比变动值,单位为个;△P表示价格同比变动值,单位为美元。取需求弹性系数的绝对值|Ed|作为分析数据时的参考系数。 3.数据分析:根据|Ed|的数值可分析该区域商品的需求价格弹性。(1)|Ed|=1(单位需求价格弹性),说明需求量变动幅度与价格变动幅度相同;(2)1<|Ed|(需求富有弹性),说明需求量变动幅度大于价格变动幅度;(3)|Ed|<1(需求缺乏弹性),说明需求量变动幅度小于价格变动幅度。
To better understand the overseas market demand status of cross-border e-commerce in Xiamen City, overseas market demand elasticity data is collected and calculated. If the proportion of change in demand quantity is greater than the ratio of price fluctuation, the overseas market demand is price elastic, meaning that overseas users have high sensitivity to price changes of products in this category. The greater the elasticity, the more sensitive the demand is to price changes, and all enterprises in this industry can appropriately lower product prices in this region to obtain higher revenues. This dataset holds significant importance for the marketing decision-making of all enterprises in this industry in this region. 1. Data Collection: Collect monthly demand data and price data for the sales regions of cross-border merchants in Xiamen City, organize and aggregate the data at the municipal level to obtain the change values of demand quantity and price changes of the overseas-sold products. 2. Algorithm Rules: Calculate the collected data using the following formula to obtain the demand elasticity coefficient: Demand Elasticity Coefficient = - (ΔQ (unit: piece) / Q (unit: piece, product demand quantity of the previous month)) / (ΔP (unit: USD) / P (unit: USD, product price of the previous month)) In the formula: Q represents the product demand quantity of the previous month, with the unit of piece; P represents the product price of the previous month, with the unit of USD; ΔQ represents the year-on-year change value of demand quantity, with the unit of piece; ΔP represents the year-on-year change value of price, with the unit of USD. Take the absolute value |Ed| of the demand elasticity coefficient as the reference coefficient for data analysis. 3. Data Analysis: The price elasticity of demand for commodities in this region can be analyzed based on the value of |Ed|: (1) |Ed|=1 (Unitary price elasticity of demand): indicates that the magnitude of change in demand quantity is consistent with that of price change; (2) 1<|Ed| (Price elastic demand): indicates that the magnitude of change in demand quantity is greater than that of price change; (3) |Ed|<1 (Price inelastic demand): indicates that the magnitude of change in demand quantity is smaller than that of price change.