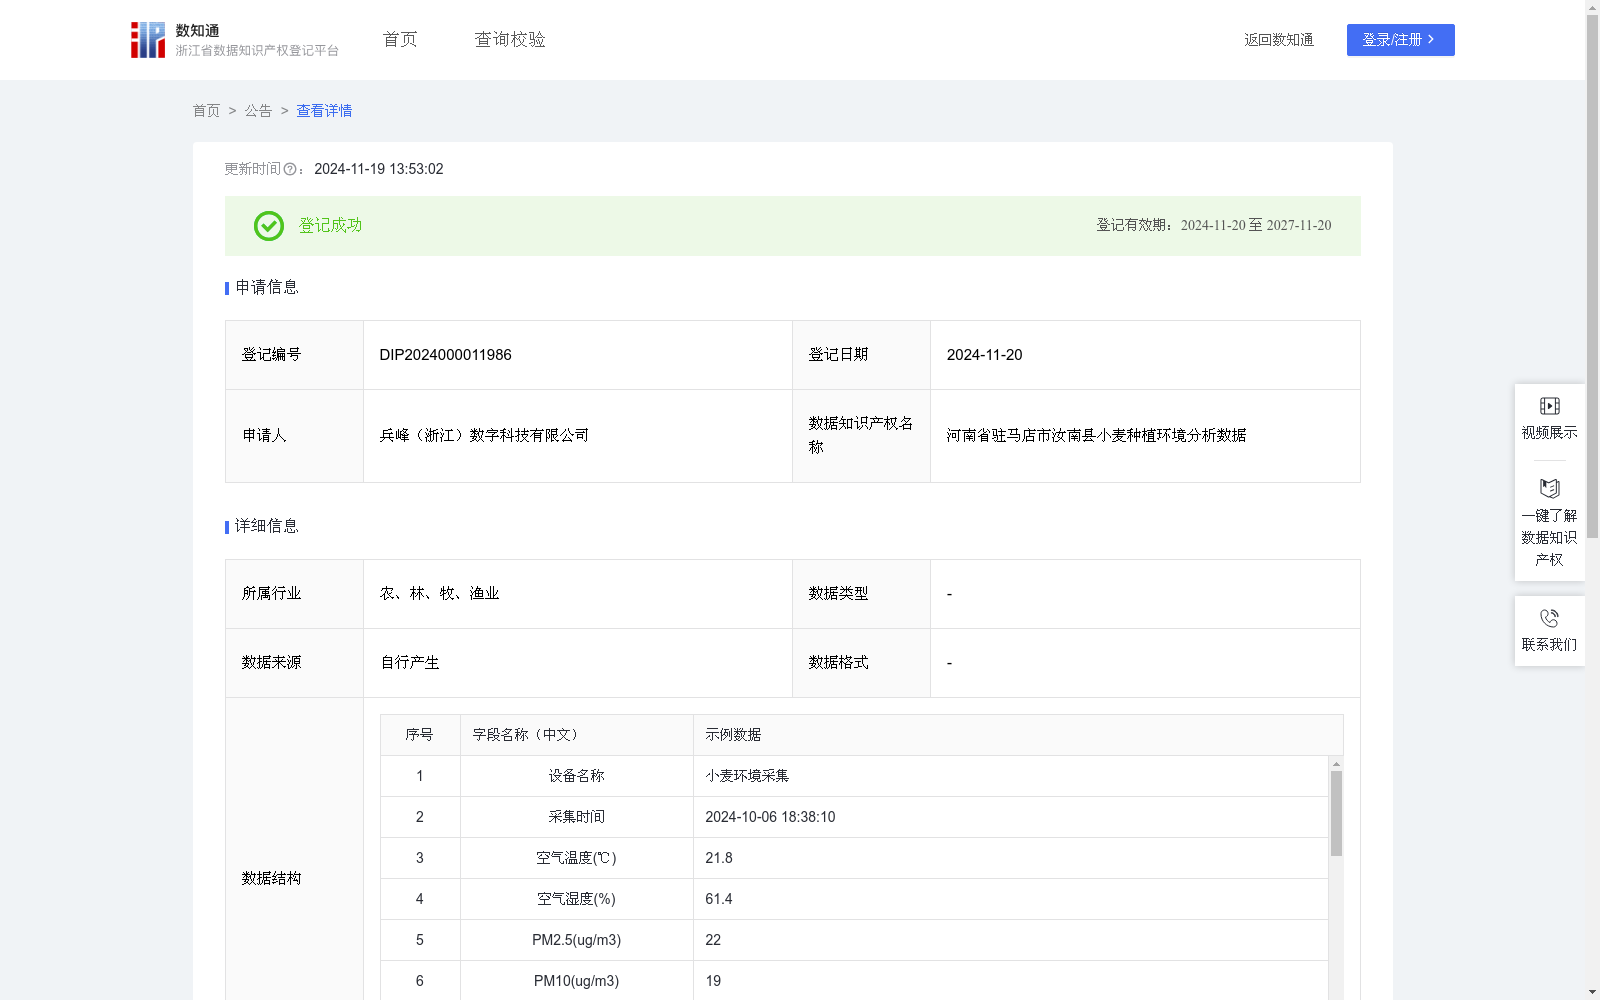
河南省驻马店市汝南县小麦种植环境分析数据
收藏浙江省数据知识产权登记平台2024-11-19 更新2024-11-20 收录
下载链接:
https://www.zjip.org.cn/home/announce/trends/86253
下载链接
链接失效反馈官方服务:
资源简介:
采集小麦种植的土壤湿温度、土壤盐度、土壤 pH 值、土壤电导率、空气温湿度、光照强度、雨量、二氧化碳浓度等数据,全面评估不同环境条件对小麦生长的具体影响。如确定适宜的土壤温度和湿度区间以促进小麦根系的良好发育,明确合适的土壤盐度和 pH 值范围以保障小麦对养分的有效吸收,了解恰当的土壤电导率水平以维持土壤的肥力平衡。同时,把握合适的光照强度和时长以提升小麦的光合作用效率,监测适宜的空气温湿度为小麦生长提供良好的大气环境,以及合理的雨量和二氧化碳浓度以满足小麦生长的水分和碳源需求。利用这些数据构建小麦品质与环境参数关联的深度网络模型,深入探索何种环境条件组合可以使小麦具有更高的蛋白质含量、更优的籽粒饱满度和更好的口感等,为显著提升小麦品质奠定基础。基于数据驱动的方式,为小麦种植环境的智能调控提供有效的支持,依据实时数据自动调整灌溉量、施肥量、通风强度以及遮阳程度等,为小麦创造适宜的生长环境,提高种植效率和产量。将优化后的环境调控经验推广应用至不同地区的小麦种植中,形成多维度细粒度的感知与控制模式,有力推动小麦种植产业朝着科学、高效、模式可移植的方向发展,全面提升整个产业的竞争力。1.数据采集:本系统通过土壤湿温度传感器、土壤盐度传感器、土壤 pH传感器、土壤电导率传感器、空气温湿度传感器、光照强度传感器、雨量传感器、二氧化碳传感器等物联网设备,结合4G/5G、Wi-Fi与有线网络,实时采集小麦种植环境中的土壤湿温度、土壤盐度、土壤 pH 值、土壤电导率等多维数据。数据经过清洗和集成技术的处理,确保其准确性与一致性,为后续分析提供高质量的数据基础。
2.算法规则:系统采用环境参数评分算法,对环境数据进行评分。评分基于小麦生长的理想条件(如土壤湿温度、土壤盐度等),并通过以下公式计算:
环境参数评分 = 100 - Σ ( w_i × |当前值_i - 理想值_i| / 容差_i )
其中,Σ 表示对所有参数的累加,w_i 是第 i 个参数的权重。当前值_i 是第 i 个参数的实际测量值,理想值_i 是第 i 个参数的理想值。容差_i 是第 i 个参数的允许波动范围,偏离理想值越多,扣分越大。
3.调控方案
系统根据分析结果将自动生成环境调控方案,针对多维度环境参数进行精细调整,确保环境条件始终维持在理想状态,从而提高作物的质量和产量。
This dataset collects multi-dimensional environmental data including soil moisture and temperature, soil salinity, soil pH value, soil electrical conductivity, air temperature and humidity, light intensity, rainfall, and carbon dioxide concentration for wheat cultivation, aiming to comprehensively evaluate the specific impacts of different environmental conditions on wheat growth. Specifically, it aims to determine suitable ranges of soil temperature and moisture for robust root development, appropriate soil salinity and pH values for effective nutrient uptake by wheat, optimal soil electrical conductivity levels to maintain soil fertility balance, proper light intensity and duration to enhance photosynthetic efficiency, suitable air temperature and humidity to provide favorable atmospheric conditions, and appropriate rainfall and carbon dioxide concentrations to meet the water and carbon source requirements of wheat growth. Based on these data, a deep network model correlating wheat quality and environmental parameters is constructed to deeply explore which environmental condition combinations can yield wheat with higher protein content, better grain plumpness, and improved taste, laying a foundation for significantly improving wheat quality. By adopting a data-driven approach, the dataset provides effective support for intelligent regulation of wheat cultivation environments, automatically adjusting irrigation volume, fertilization rate, ventilation intensity, and shading degree based on real-time data to create favorable growth conditions for wheat and improve planting efficiency and yield. The optimized environmental regulation experience will be promoted and applied to wheat cultivation in different regions, forming a multi-dimensional fine-grained perception and control model, effectively promoting the wheat planting industry towards a scientific, efficient, and mode-transplantable development direction, and comprehensively enhancing the competitiveness of the entire industry.
1. Data Collection: This system collects multi-dimensional data such as soil moisture and temperature, soil salinity, soil pH value, and soil electrical conductivity in wheat cultivation environments in real time via IoT devices including soil moisture and temperature sensors, soil salinity sensors, soil pH sensors, soil electrical conductivity sensors, air temperature and humidity sensors, light intensity sensors, rainfall sensors, and carbon dioxide sensors, combined with 4G/5G, Wi-Fi and wired networks. The collected data is processed through data cleaning and integration technologies to ensure its accuracy and consistency, providing a high-quality data basis for subsequent analysis.
2. Algorithm Rules: The system adopts an environmental parameter scoring algorithm to score the environmental data. The scoring is based on the ideal growth conditions for wheat (such as soil moisture and temperature, soil salinity, etc.), and is calculated using the following formula:
Environmental Parameter Score = 100 - Σ ( w_i × |Current Value_i - Ideal Value_i| / Tolerance_i )
Where Σ represents the summation over all parameters, w_i is the weight of the i-th parameter, Current Value_i is the actual measured value of the i-th parameter, Ideal Value_i is the ideal value of the i-th parameter, and Tolerance_i is the allowable fluctuation range of the i-th parameter. The more the value deviates from the ideal value, the greater the penalty points deducted.
3. Regulation Scheme: The system will automatically generate environmental regulation schemes based on the analysis results, and finely adjust multi-dimensional environmental parameters to ensure that environmental conditions are always maintained at ideal levels, thereby improving crop quality and yield.
提供机构:
兵峰(浙江)数字科技有限公司
创建时间:
2024-10-18
搜集汇总
数据集介绍
以上内容由遇见数据集搜集并总结生成


