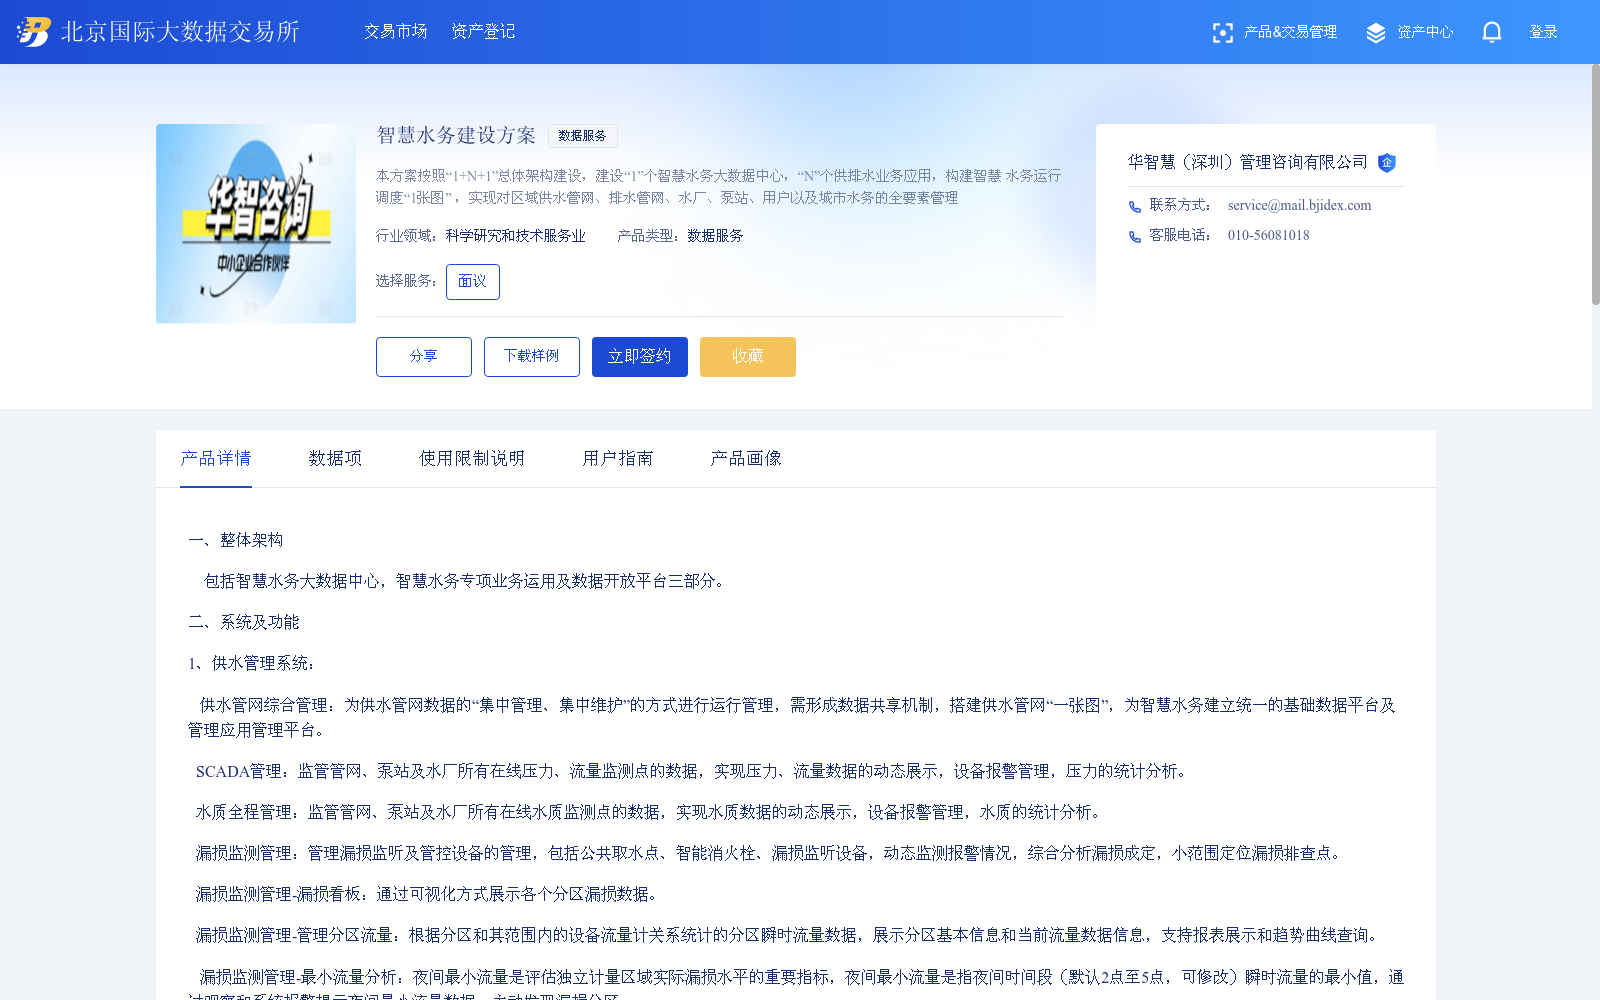
智慧水务建设方案
收藏北京国际大数据交易所2024-05-21 收录
下载链接:
https://webs.bjidex.com/sys-bsc-home/#/bscConsole/tradingMarket/detail?id=1842
下载链接
链接失效反馈官方服务:
资源简介:
一、整体架构 包括智慧水务大数据中心,智慧水务专项业务运用及数据开放平台三部分。二、系统及功能1、供水管理系统: 供水管网综合管理:为供水管网数据的“集中管理、集中维护”的方式进行运行管理,需形成数据共享机制,搭建供水管网“一张图”,为智慧水务建立统一的基础数据平台及管理应用管理平台。 SCADA管理:监管管网、泵站及水厂所有在线压力、流量监测点的数据,实现压力、流量数据的动态展示,设备报警管理,压力的统计分析。 水质全程管理:监管管网、泵站及水厂所有在线水质监测点的数据,实现水质数据的动态展示,设备报警管理,水质的统计分析。 漏损监测管理:管理漏损监听及管控设备的管理,包括公共取水点、智能消火栓、漏损监听设备,动态监测报警情况,综合分析漏损成定,小范围定位漏损排查点。 漏损监测管理-漏损看板:通过可视化方式展示各个分区漏损数据。 漏损监测管理-管理分区流量:根据分区和其范围内的设备流量计关系统计的分区瞬时流量数据,展示分区基本信息和当前流量数据信息,支持报表展示和趋势曲线查询。 漏损监测管理-最小流量分析:夜间最小流量是评估独立计量区域实际漏损水平的重要指标,夜间最小流量是指夜间时间段(默认2点至5点,可修改)瞬时流量的最小值,通过观察和系统报警提示夜间最小流量数据,主动发现漏损分区。 漏损监测管理-漏损分析:基于监测数据和分区的供水量和售水量还有一部分未计量水量的差值计算得来的漏损量,分析各分区的漏损水平。漏损监测管理-产销差统计:产销差是根据分区的供水量和售水量的差值统计所得,集中展示月产销量、漏损率统计与排名-漏损率占比(一级、二级、三级、四级)。供水运行指挥调度:在网页上浏览调度系统的管网、供水泵房、水厂等各类数据,并实现调度管理、设备辅助管理、系统配置管理等功能,从而保障城市公共服务的质量和城市供水安全。能耗管理与分析:通过对水厂、泵站监控中采集到的能耗数据,实现对水厂/泵站、机组组、单个水泵的运行效率、单耗的分析统计并可对历史数据进行挖掘分析,实现指导优化泵房机组的搭配,从而达到降低泵房能耗,节约升本,提升经济效益的目的。供水管网水力模型:将传统的水力计算模型与GIS平台相结合,进行水力、水质、水锤等模拟分析,查找管网运行中存在的问题,为供水系统的实际运行提供辅助决策支持。2、排水管理系统 综合管控GIS一张图:在水务大数据中心的基础上,引入排水模型算法,对排水大数据进行挖掘分析,把控泵站的区域调度分析、管道淤积分析、管道溢流风险分析、管道破损分析等高级分析功能,通过提供可靠的数据支撑,辅助管网规划、调度及决策等业务管理内容,使排水系统的整个运营达到“智慧运行”的状态。 监测预警分析:以监测点的信息展示为重心,集成在线监测设备、移动信息化、物联网等技术进行集中展示,逐步实现全区排水管网、截流泵站、区域性泵站、农村提升泵站、污水处理厂等排水设施资源统一管理、统一监测。 巡查养护管理:建立管网业务流程化管理,对厂、站、网、户等的日常巡查、检查情况进行综合管理与统计分析,制定巡检路线和查询路线轨迹,派发工作单,实时定位巡检人员位置,对巡检人员工作状态进行实时、动态管理,并及时反馈现场情况(照片或者视频)。 抢维修工程管理:通过手机实现工作单管理、工作单派发、工作单跟踪、业务流程管理、信息反馈等,全面提高维修服务工作的管理能力,形成业务流程的全周期管理,大大方便了管理层的工作监督和决策依据的获取。 市政设施井盖监测:实现对井盖状态监控(异常开启、维修管理)、实时报警、自动巡检、及时处置等功能、保障安全运行,进一步提高市政管理的信息化、智能化水平,为智慧城市奠定行业应用基础。 资产全周期管理:基于智慧水务大数据中心的数据基础上,将管网、设备资产的购买、安装、设备参数资料、运行状态、维修记录、报废的全过程形成报表进行监控管理,并实现可在智慧水务平台的GIS地图上和现场设施的二维码上都可查看过程记录。 泵站远程控制:实时监控泵站的水位及设备运行状态,能够对水位异常点位进行报警提示,包括泵站的启停能够根据水位的变化实现远程自动化控制,上位机监控负责排水泵站的控制和管理。 排水户管理:结合地图可视化展示,实现对排水户的全方位管理,可以为快速解决排水户碰到的排水问题提供支持,为排水系统排水户合法接入、排水系统水量水质分析、水环境控制提供依据。 城市内涝监测预警:城市内涝监测预警集成各采集点数据,生成多个管理系统示意图,能够直观显示各监测点位置分布、当前水位、路桥积水点、河道水位、排水管网流量、泵站设备运行情况等信息,当水位高于预设水位线,系统发出报警,帮助政府管理部门制定排涝决策、安排合理的调度方案。 细分场景监测-低洼路段:液位探测器安装于易涝点路面,可实时采集道路积水水位数据,通过自组网 LoRa 通信方式将数据上报到监测主机。监测主机通过 LoRa 通信接收到探测器上报的数据后,再经无线 4G /5G通信,将水位数据上报到服务端,领导可通过业务软件及时了解到当前积水情况。监测主机根据积水监测信息通过图像摄像机实现对现场情况拍照记录。 细分场景监测-隧道/下穿桥:隧道积水监测系统主要由电子水尺、监测主机及服务端组成。电子水尺安装于桥下易涝点, 可实时采集桥洞积水水位数据,监测主机通过无线 4G 通信,将水位数据上报到服务端,领导可通过业务软件及时了解到当前积水情况 细分场景监测-地下管道液位:超声波液位监测仪安装于窨井易涝点,可实时采集窨井水位数据,通过无线 4G/5G通信,将水位数据上报到服务端,业务部门可通过业务软件及时了解到当前窨井内的水位和道路积水水位,主要起到预警报警的作用,可有效预防城市内涝的发生。 城市内涝监测预警:对所有站点的积水数据的进行实时接收,处理、存储接收到的数据,一张图展示全市所有线路及积水情况。 预警信息联动指挥:结合户外LED大屏、短信通知、微信公众号等多种手段,完成雨情、水情、气象、灾情、暴雨预警、交通管制等信息的逐级发布和响应反馈的互动支持,同时微信公众号提供上报灾情通道,全面提高全民防灾自救的能力,营造全社会关心、支持、参与防汛工作的良好氛围。3、智慧调度模拟指挥系统 基于智慧水务大数据中心相关数据进行综合分析,模拟不同工况条件下的调度实施效果,开展实时信息查询分析、调度方案启用判断、调度方案模拟评估、闸泵优化调度分析,为防洪及水环境调度专业技术人员和指挥决策人员提供科学模拟分析的调度决策支持服务。4、大数据领导驾驶舱 排水规划总览 建设工程总览 排水设施资产总览 排水设施运行总览 巡查养护情况总览 厂站网调度总览 污水监管总览 泵站运行情况总览5、所需硬件 管网液位监测仪,管网流量监测仪 管网压力变送器, 手持管网探测器,水质检测设备,管道标书器,PLC远传多功能一体机,井盖监测器等.
I. Overall Architecture
This system includes three parts: smart water big data center, special smart water business applications, and data open platform.
II. System and Functions
1. Water Supply Management System
Comprehensive Management of Water Supply Network: Adopts the mode of "centralized management and centralized maintenance" for the operation management of water supply network data, establishes a data sharing mechanism, builds a "one-map" for water supply networks, and constructs a unified basic data platform and management application platform for smart water affairs.
SCADA Management: Monitors and manages data from all online pressure and flow monitoring points of pipe networks, pump stations and water plants, realizes dynamic display of pressure and flow data, equipment alarm management, and statistical analysis of pressure.
Whole-process Water Quality Management: Monitors and manages data from all online water quality monitoring points of pipe networks, pump stations and water plants, realizes dynamic display of water quality data, equipment alarm management, and statistical analysis of water quality.
Leakage Monitoring Management: Manages leakage monitoring and control equipment, including public water intake points, smart fire hydrants and leakage monitoring devices, dynamically monitors alarm status, comprehensively analyzes leakage causes, and locates small-scale leakage inspection points.
Leakage Monitoring Management - Leakage Dashboard: Displays leakage data of each zoning area through visualization.
Leakage Monitoring Management - Management Zonal Flow: Counts the instantaneous flow data of the zone based on the zonal and its internal equipment flowmeter relationships, displays basic zone information and current flow data, supports report display and trend curve query.
Leakage Monitoring Management - Minimum Flow Analysis: The night minimum flow is an important indicator to evaluate the actual leakage level of an independent metering zone. It refers to the minimum instantaneous flow during the night period (default 2:00-5:00, adjustable). By observing the night minimum flow data and system alarm prompts, leakage zones can be actively identified.
Leakage Monitoring Management - Leakage Analysis: Calculates the leakage volume based on the difference between water supply, water sales and unmeasured water volume of each zone, and analyzes the leakage level of each zoning area.
Leakage Monitoring Management - Water Supply-Sales Difference Statistics: The water supply-sales difference is calculated based on the difference between water supply and water sales of each zone, and centrally displays monthly water supply and sales volume, leakage rate statistics and ranking - leakage rate proportion (Level 1, Level 2, Level 3, Level 4).
Water Supply Operation Command and Dispatch: Browses various data such as pipe networks, water supply pump stations and water plants of the dispatch system on the web, and realizes functions such as dispatch management, equipment auxiliary management and system configuration management, so as to ensure the quality of urban public services and urban water supply safety.
Energy Consumption Management and Analysis: Collects energy consumption data from water plants and pump stations, realizes statistical analysis of operating efficiency and unit consumption of water plants/pump stations, unit sets and individual water pumps, and can mine and analyze historical data to guide the optimization of pump house unit matching, thereby reducing pump house energy consumption, cutting costs and improving economic benefits.
Hydraulic Model of Water Supply Network: Combines traditional hydraulic calculation models with GIS platforms to conduct simulation analysis of hydraulics, water quality, water hammer and other issues, finds out problems existing in pipe network operation, and provides auxiliary decision support for the actual operation of water supply systems.
2. Drainage Management System
Comprehensive Management GIS One-Map: Based on the smart water big data center, introduces drainage model algorithms to mine and analyze drainage big data, and carries out advanced analysis functions such as regional dispatch analysis of pump stations, pipeline siltation analysis, pipeline overflow risk analysis and pipeline damage analysis. Provides reliable data support to assist business management contents such as pipe network planning, dispatch and decision-making, so that the entire operation of the drainage system achieves the state of "smart operation".
Monitoring and Early Warning Analysis: Focuses on the information display of monitoring points, integrates technologies such as online monitoring equipment, mobile informatization and Internet of Things for centralized display, and gradually realizes unified management and unified monitoring of drainage facility resources such as regional drainage pipe networks, interception pump stations, regional pump stations, rural lift pump stations and sewage treatment plants.
Patrol and Maintenance Management: Establishes process-based pipe network management, comprehensively manages and statistically analyzes the daily patrol and inspection status of plants, stations, pipe networks and households, formulates patrol routes and query routes, dispatches work orders, locates the position of patrol personnel in real time, conducts real-time and dynamic management of the working status of patrol personnel, and feeds back on-site conditions (photos or videos) in time.
Emergency Repair and Maintenance Project Management: Realizes work order management, work order dispatch, work order tracking, business process management and information feedback through mobile phones, comprehensively improves the management ability of maintenance services, forms full-life-cycle management of business processes, and greatly facilitates the work supervision of management layer and acquisition of decision-making basis.
Municipal Facility Manhole Cover Monitoring: Realizes functions such as manhole cover status monitoring (abnormal opening, maintenance management), real-time alarm, automatic patrol and timely disposal, ensures safe operation, further improves the informatization and intelligent level of municipal management, and lays an industry application foundation for smart cities.
Full-life-cycle Asset Management: Based on the data of the smart water big data center, forms reports to monitor and manage the whole process of purchase, installation, equipment parameter data, operating status, maintenance records and scrapping of pipe network and equipment assets, and realizes that the process records can be viewed on both the GIS map of the smart water platform and the QR code of on-site facilities.
Remote Control of Pump Stations: Monitors the water level and equipment operating status of pump stations in real time, can give alarms for abnormal water level points, including that the start and stop of pump stations can realize remote automatic control according to water level changes, and the upper computer monitoring is responsible for the control and management of drainage pump stations.
Drainage Household Management: Combines map visualization to realize all-round management of drainage households, provides support for quickly solving drainage problems encountered by drainage households, and provides a basis for legal access of drainage households to drainage systems, water quantity and quality analysis of drainage systems and water environment control.
Urban Waterlogging Monitoring and Early Warning: Integrates data from various collection points to generate multiple management system schematic diagrams, which can intuitively display information such as the location distribution of each monitoring point, current water level, road bridge waterlogging points, river water level, drainage pipe network flow and pump station equipment operating status. When the water level exceeds the preset water level line, the system sends an alarm to help government management departments formulate flood drainage decisions and arrange reasonable dispatch plans.
Sub-scenario Monitoring - Low-lying Road Sections: Liquid level detectors are installed on the road surfaces of waterlogging-prone points, which can collect road ponding water level data in real time, and report the data to the monitoring host through self-organizing LoRa communication. After receiving the data reported by the detectors through LoRa communication, the monitoring host reports the water level data to the server through wireless 4G/5G communication, and leaders can timely understand the current ponding status through the business software. The monitoring host takes photos and records the on-site situation through image cameras based on the waterlogging monitoring information.
Sub-scenario Monitoring - Tunnels/Underpasses: The tunnel ponding monitoring system is mainly composed of electronic staff gauges, monitoring hosts and servers. Electronic staff gauges are installed at waterlogging-prone points under bridges, which can collect water level data of bridge cavity ponding in real time. The monitoring host reports the water level data to the server through wireless 4G communication, and leaders can timely understand the current ponding status through the business software.
Sub-scenario Monitoring - Underground Pipeline Liquid Level: Ultrasonic liquid level monitors are installed at waterlogging-prone points of manholes, which can collect manhole water level data in real time, and report the water level data to the server through wireless 4G/5G communication. Business departments can timely understand the current manhole water level and road ponding water level through the business software, which mainly plays a role in early warning and alarm, and can effectively prevent the occurrence of urban waterlogging.
Urban Waterlogging Monitoring and Early Warning: Conducts real-time reception, processing and storage of waterlogging data from all stations, and displays all lines and waterlogging situations in the city on a one-map.
Early Warning Information Joint Command: Combines multiple means such as outdoor LED large screens, SMS notifications and WeChat official accounts to complete interactive support for step-by-step release and response feedback of information such as rain conditions, water conditions, meteorology, disasters, rainstorm warnings and traffic control. At the same time, the WeChat official account provides a disaster reporting channel, comprehensively improves the ability of the whole people to prevent disasters and self-rescue, and creates a good atmosphere for the whole society to care about, support and participate in flood control work.
3. Smart Dispatch Simulation Command System
Based on the relevant data of the smart water big data center for comprehensive analysis, simulates the dispatch implementation effects under different working conditions, carries out real-time information query and analysis, dispatch scheme activation judgment, dispatch scheme simulation evaluation, gate and pump optimal dispatch analysis, and provides scientific simulation analysis and dispatch decision support services for flood control and water environment dispatch professionals and command decision-makers.
4. Big Data Leader Dashboard
Drainage Planning Overview
Construction Project Overview
Drainage Facility Asset Overview
Drainage Facility Operation Overview
Patrol and Maintenance Overview
Overview of Plant, Pump Station and Pipe Network Dispatch
Sewage Supervision Overview
Pump Station Operation Overview
5. Required Hardware
Pipeline level monitoring instrument, pipeline flow monitoring instrument, pipeline pressure transmitter, handheld pipeline detector, water quality testing equipment, pipeline marker, PLC remote transmission multi-function integrated machine, manhole cover monitor, etc.
提供机构:
华智慧(深圳)管理咨询有限公司
搜集汇总
数据集介绍
以上内容由遇见数据集搜集并总结生成


