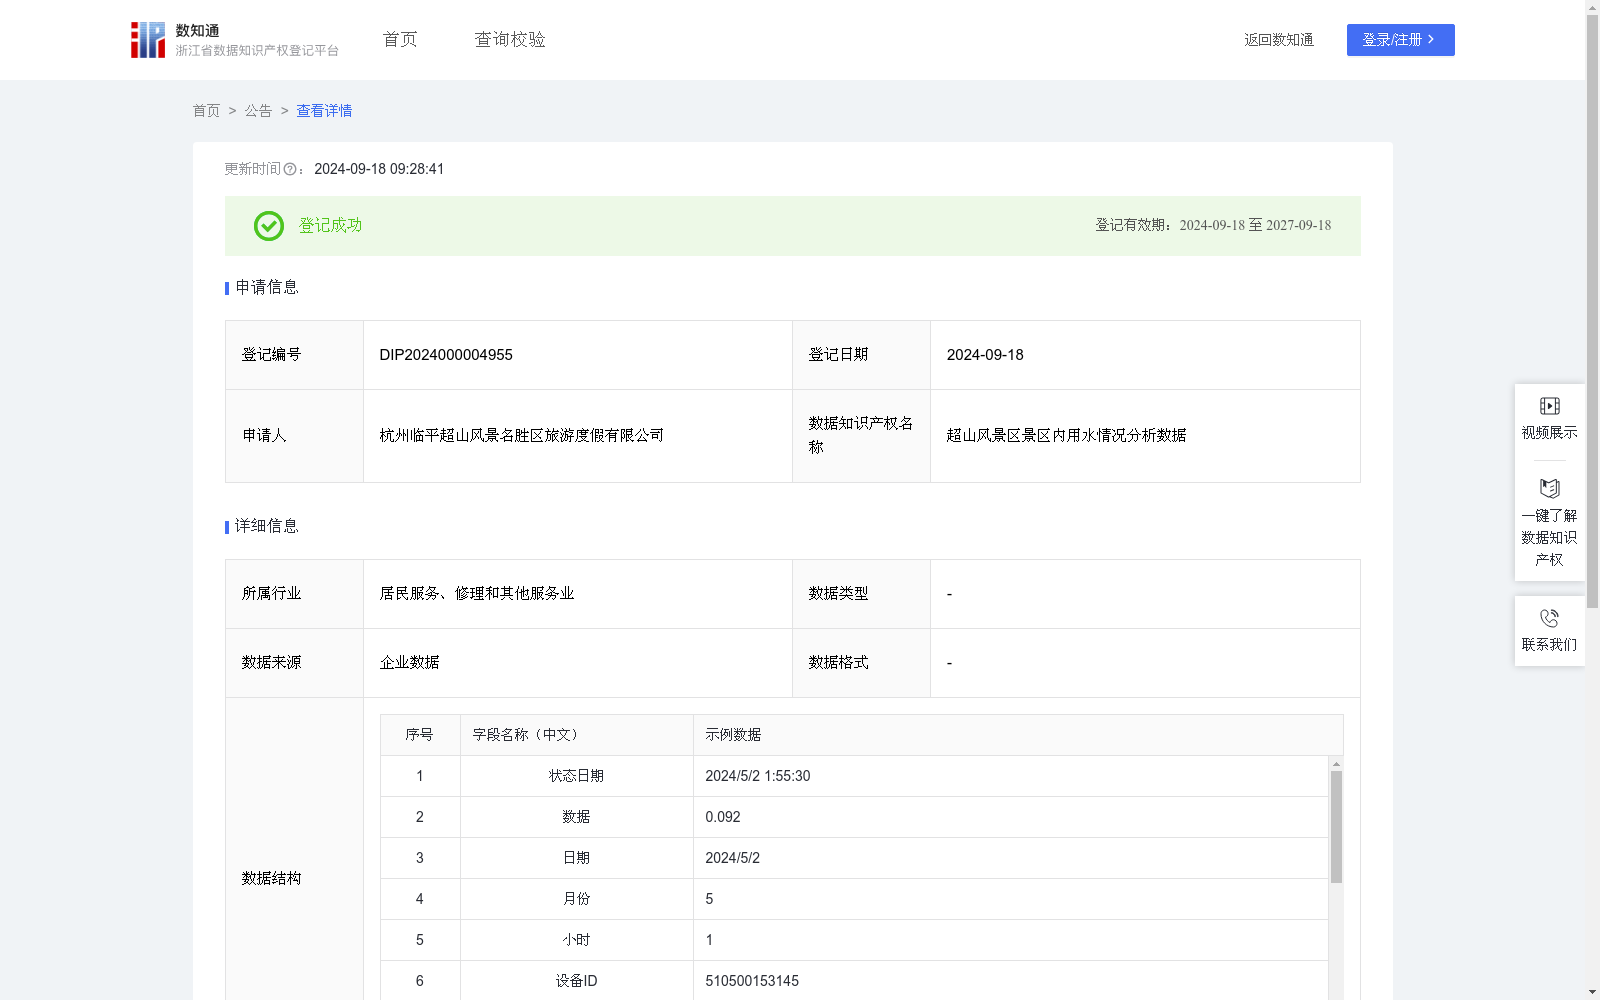
超山风景区景区内用水情况分析数据
收藏浙江省数据知识产权登记平台2024-09-18 更新2024-09-19 收录
下载链接:
https://www.zjip.org.cn/home/announce/trends/62076
下载链接
链接失效反馈官方服务:
资源简介:
通过超山风景区各设备用水数据的详细统计和分析,掌握景区内各点位的用水消耗情况(单日用水量、单月用水量、每日用水均值、用水峰值、用水最低值以及单日用水量增长率等),通过分析用水量数据,景区可以更好地预测和控制运营成本;也可以透视旅游发展情况,为文旅业高质量发展提供支持。此外,用水数据可以作为行业市场分析的一部分,帮助了解游客流量和行为模式,为市场营销策略提供数据支持;政府或相关机构也可以利用这些数据来制定或调整能源政策,促进能源的合理使用和分配。1、数据采集:通过超山风景区智能监控平台采集景区内各点位用水情况数据,包含:状态日期、数据、日期、月份、小时、设备ID、计量数据、设备名称等字段;
2、数据处理:对数据进行清洗、去除无效数据和极限数据等操作;
3、算法规则:通过MIXIFS函数和MINIFS函数计算用水峰值和用水最低值,使用SUMIFS函数计算单日用水量;单月用水量=∑(单日用水量);每日用水均值=∑(单日用水量)/当月记录天数;单日用水量增长率=(单日用水量-昨日用水量)/昨日用水量;
4、数据应用:通过可视化界面直观展现景区内各点位用水情况,根据实时数据监控用水增长率.
Through detailed statistics and analysis of water consumption data of various pieces of equipment in Chaoshan Scenic Area, the water consumption status of each location within the scenic area can be mastered, including indicators such as daily water consumption, monthly water consumption, average daily water consumption, water consumption peak, minimum water consumption, and daily water consumption growth rate. By analyzing the water consumption data, the scenic area can better predict and control operating costs; it can also gain insights into tourism development trends and provide support for the high-quality development of the cultural and tourism industry. In addition, water consumption data can serve as part of industry market analysis, helping to understand tourist flow and behavioral patterns, and providing data support for marketing strategies; government agencies or relevant institutions can also utilize this data to formulate or adjust energy policies, and promote the rational use and allocation of energy.
1. Data Collection: Water consumption data of each location in the scenic area is collected via the Chaoshan Scenic Area Intelligent Monitoring Platform, including fields such as status date, data value, date, month, hour, equipment ID, metering data, and equipment name;
2. Data Processing: Clean the collected data, remove invalid data and outlier data, etc.;
3. Algorithm Rules: Calculate the water consumption peak and minimum water consumption using the MAXIFS and MINIFS functions respectively, and calculate the daily water consumption using the SUMIFS function. Monthly water consumption = ∑(daily water consumption); average daily water consumption = ∑(daily water consumption) / number of recorded days in the current month; daily water consumption growth rate = (daily water consumption - yesterday's water consumption) / yesterday's water consumption;
4. Data Application: Intuitively display the water consumption status of each location in the scenic area through a visual interface, and monitor the water consumption growth rate based on real-time data.
提供机构:
杭州临平超山风景名胜区旅游度假有限公司
创建时间:
2024-08-05
搜集汇总
数据集介绍
特点
该数据集记录了超山风景区景区内各点位的用水情况,包括单日用水量、单月用水量、每日用水均值等指标,用于分析景区用水消耗和游客行为模式,支持运营成本控制和文旅业发展。
以上内容由遇见数据集搜集并总结生成


