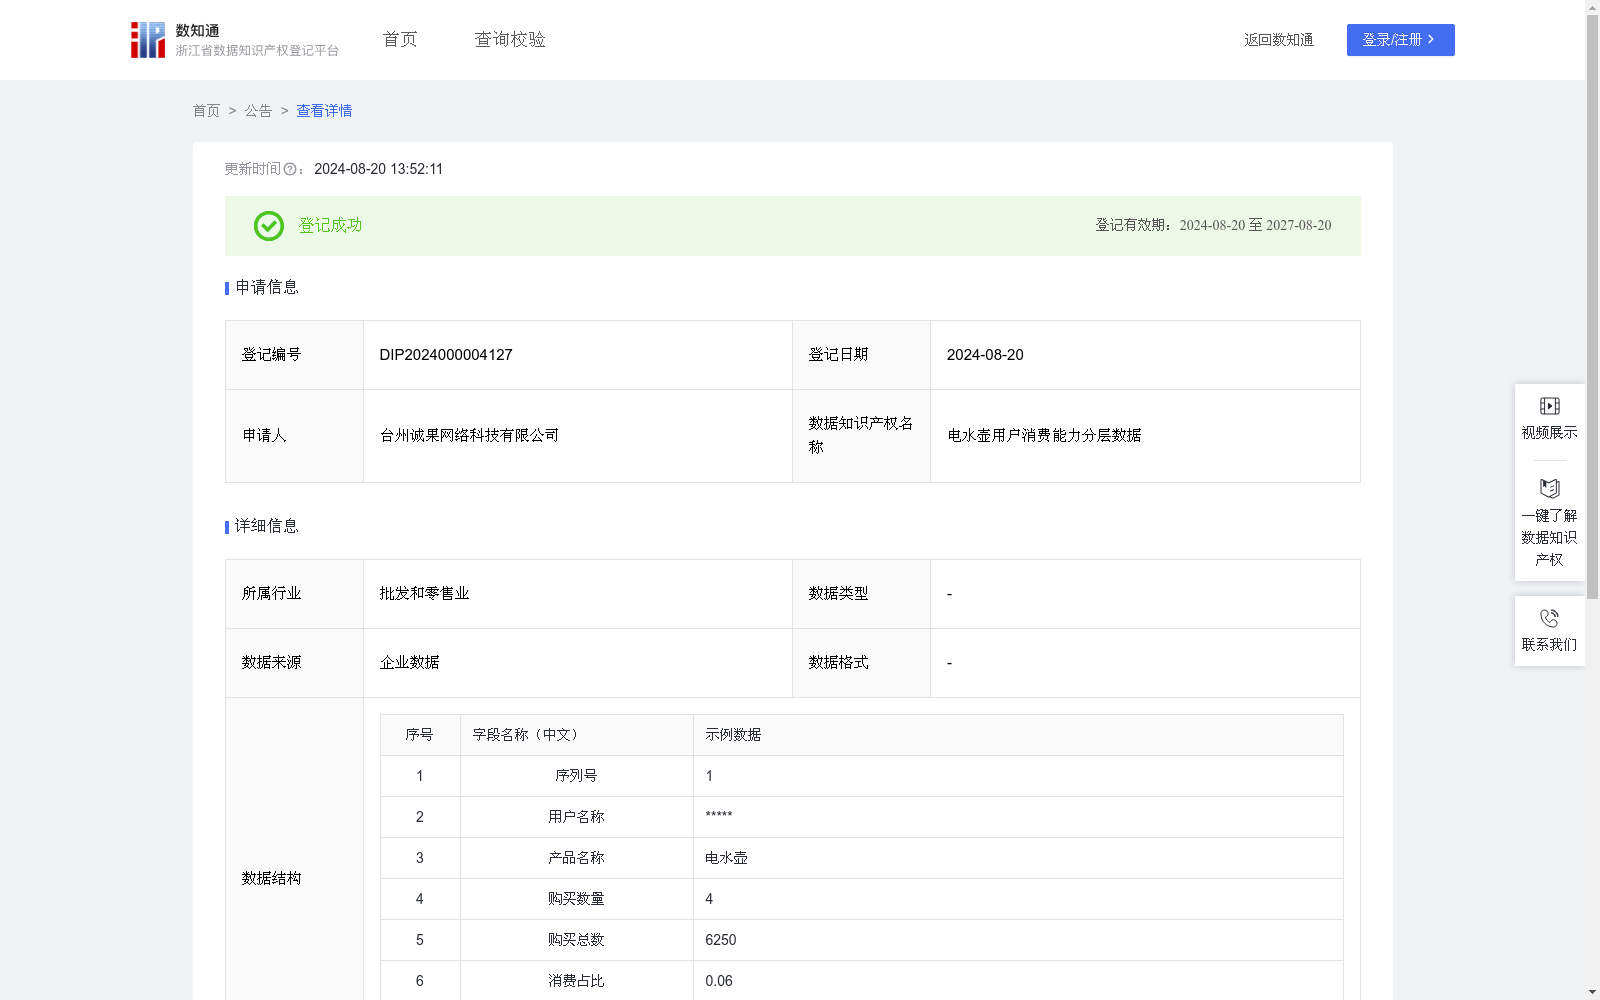
电水壶用户消费能力分层数据
收藏资源简介:
电水壶在1891年诞生于芝加哥。随着科技的发展,快捷、安全、便利、充分利用能源日渐成为了水壶的主要特点,嗜茶的英国人从此便爱上它了。到了二十一世纪便成为全球的畅销品,统计分析电水壶的消费数据,通过对历史下单用户建立表格,对用户进行标签制定,定位用户消费级别,为企业在全国各地设立产品周转仓对电水壶的购买量和使用量,制定广告营销策略提供数据支持。1. 数据采集:采集电水壶在各个维修店消费等信息; 2. 用户购买电水壶数量占总消费电水壶数量的比例=用户购买电水壶数量/总消费电水壶数量*100%; 3. 用户消费占总消费的比例按从大到小进行排名;消费分类运用ABCDEF分类法,对占比0.26%以上的,给予“A类消费”分层;占比0.21%到0.25%区间的,则给予“B类消费”分层;占比在0.16%到0.20%区间,则给予“C类消费”分层;占比在0.11%到0.15%区间,则给予“D类消费”分层;占比在0.06%到0.1%区间,则给予“E类消费”分层;占比在0.05%以下,则给予“F类消费”分层; 4. 数据应用: 电水壶的购买力结果可以作为电水壶消费等级评价依据,为监管部门向监管提供技术支撑。
The electric kettle was invented in Chicago in 1891. With the advancement of science and technology, features such as speed, safety, convenience and efficient energy utilization have gradually become the core attributes of electric kettles, winning the favor of British tea lovers. By the 21st century, electric kettles had become globally best-selling commodities. This dataset conducts statistical analysis on the consumption data of electric kettles, including establishing tables for historical ordering users, formulating user tags, positioning user consumption tiers, and providing data support for enterprises to set up product distribution warehouses across the country, as well as developing advertising and marketing strategies based on the purchase and usage volumes of electric kettles. 1. Data Collection: Collect consumption-related information of electric kettles at various maintenance stores. 2. Proportion Calculation: The proportion of a user's purchased electric kettle quantity in the total consumption quantity is calculated as: Proportion = (User's purchased electric kettle quantity / Total consumption quantity of electric kettles) × 100%. 3. Ranking and Classification: Rank the proportion of each user's total consumption from high to low. Adopt the ABCDEF classification method for consumption categorization: users with a proportion above 0.26% are classified as "Class A Consumers"; those with a proportion ranging from 0.21% to 0.25% are "Class B Consumers"; 0.16% to 0.20% → Class C Consumers; 0.11% to 0.15% → Class D Consumers; 0.06% to 0.10% → Class E Consumers; and those with a proportion below 0.05% are "Class F Consumers". 4. Data Application: The purchasing power analysis results of electric kettles can be used as the basis for evaluating electric kettle consumption tiers, providing technical support for regulatory authorities in their supervision work.