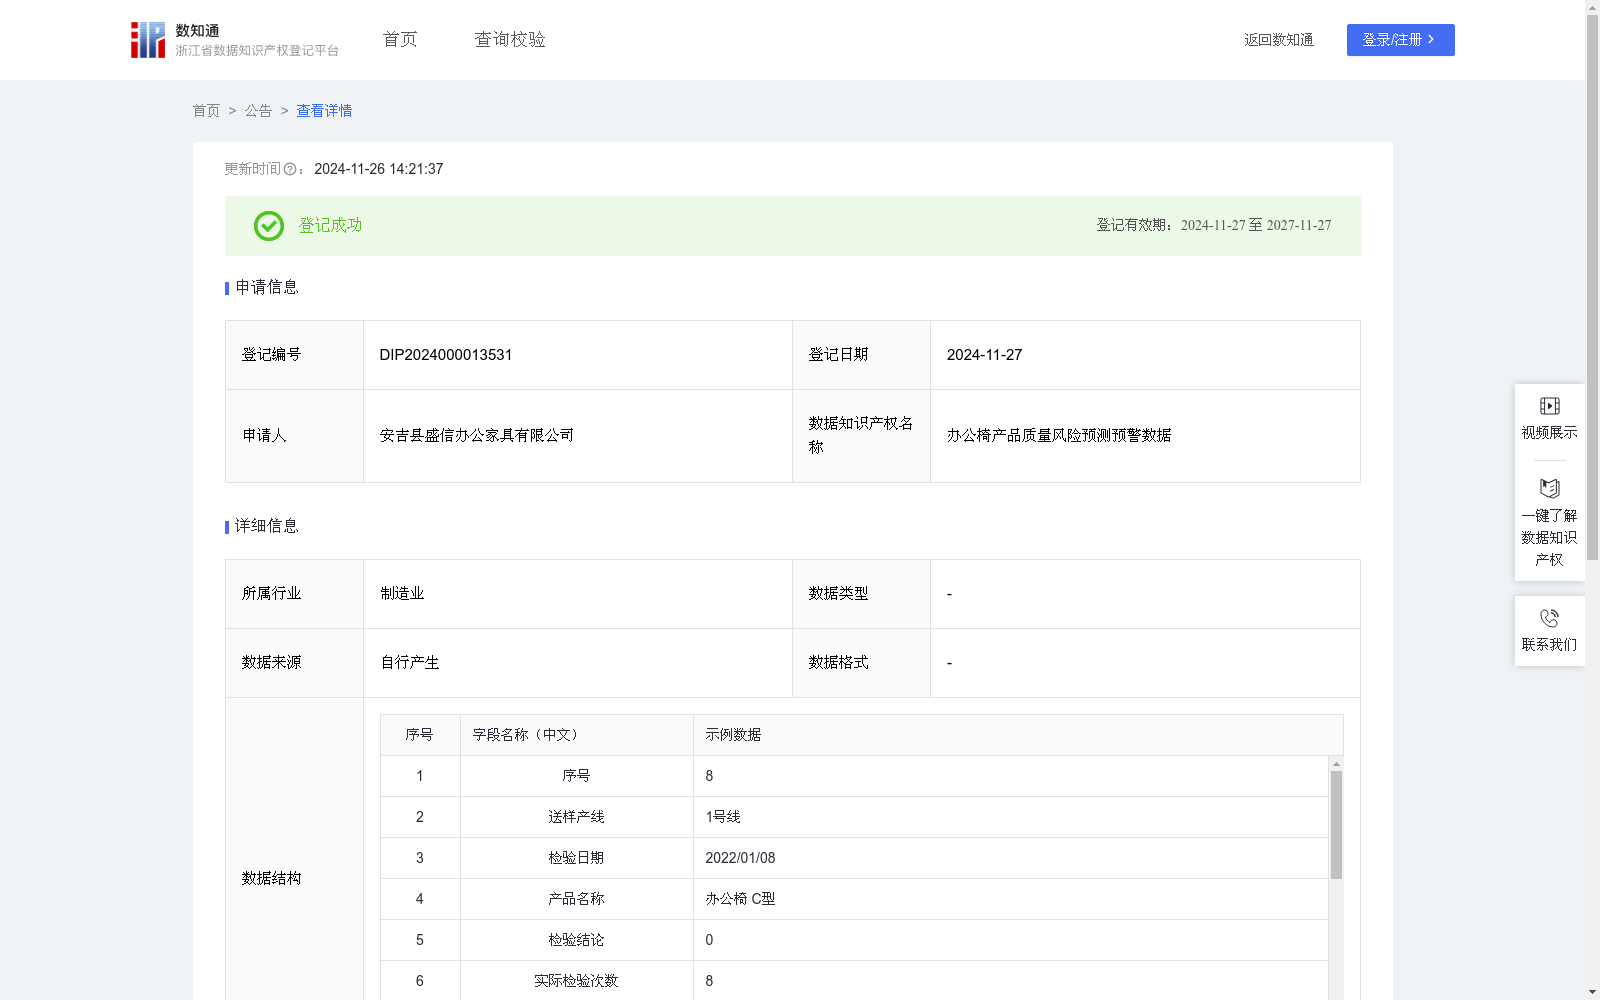
办公椅产品质量风险预测预警数据
收藏浙江省数据知识产权登记平台2024-11-26 更新2024-11-27 收录
下载链接:
https://www.zjip.org.cn/home/announce/trends/89373
下载链接
链接失效反馈官方服务:
资源简介:
办公椅产品质量风险预测预警数据是一个创新的量化工具,用于评估当前生产线上办公椅产品可能出现质量问题的风险程度并进行预警。办公椅生产企业可通过本数据了解产品的整体质量状况,优化生产流程,提高产品质量。通过分析近100次累计不合格次数、不合格率、最高连续不合格次数及其占比等指标,企业能够及时调整生产工艺,改进原材料选择,加强质量控制。这有助于降低产品缺陷率和返工风险,提高市场竞争力。当某条生产线的不合格率突然上升时,企业可迅速调查并采取纠正措施。
质量管理部门可利用本数据识别和跟踪潜在质量问题,及时采取管理措施。通过质量风险评分计算和趋势分析,可预见可能出现的质量波动,提前调整生产计划或增加检查频率。当风险评分接近或超过中风险阈值时,可发出质量警告,加强控制力度。企业管理层可将数据用于战略决策,优化资源分配。研发部门可利用数据指导产品改进和创新,提高可靠性和耐用性。供应链管理部门可评估和选择供应商,优化供应链结构。
(1)数据采集:采集办公椅产品每次送检的结果数据,包括送样产线、检验日期、产品名称、检验结论等,以便于更全面的分析。确保检验日期格式统一,便于后续的时间序列分析。
(2)数据预处理:对采集的数据进行清洗,将检验结论“不合格”和“合格”分别用1和0代替,以便后续分析和建模。2.数据加工和分析: (1)计算近100次累计不合格次数及不合格率、最高连续不合格次数及其占比。(2)建立预测预警模型:a. 质量风险评分计算:EMAt=α×当前风险t + (1−α)×EMAt−1;其中,平滑因子α设定为0.2。当前风险值t=(累计不合格率t×0.6)+(最高连续不合格次数占比t×0.4)。b. 趋势分析:趋势指标 = (最近10次EMA平均值 - 前10次EMA平均值) / 10; C.综合风险评分:综合风险评分=EMA+(趋势指标×权重因子),其中权重因子设为0.5。d. 风险等级判定:综合风险评分≤5,为低风险;5<综合风险评分≤10,为中风险;10<综合风险评分≤15,为高风险;综合风险评分>15,为极高风险。
The Office Chair Product Quality Risk Prediction and Early Warning Dataset is an innovative quantitative tool for assessing the risk level of potential quality issues of office chair products on current production lines and issuing early warnings. Office chair manufacturers can use this dataset to understand the overall quality status of their products, optimize production processes, and improve product quality. By analyzing indicators such as the cumulative number of nonconforming products, nonconformity rate, maximum consecutive nonconforming occurrences and their proportion in the latest 100 tests, enterprises can timely adjust production processes, improve raw material selection, and strengthen quality control. This helps reduce product defect rates and rework risks, and enhance market competitiveness. When the nonconformity rate of a certain production line rises suddenly, enterprises can quickly conduct investigations and take corrective actions.
Quality management departments can use this dataset to identify and track potential quality issues, and take timely management measures. Through quality risk score calculation and trend analysis, enterprises can predict potential quality fluctuations, and adjust production plans or increase inspection frequencies in advance. When the risk score approaches or exceeds the medium-risk threshold, quality warnings can be issued and control efforts strengthened. Enterprise management can use the dataset for strategic decision-making and optimize resource allocation. R&D departments can use the dataset to guide product improvement and innovation, and enhance product reliability and durability. Supply chain management departments can evaluate and select suppliers, and optimize supply chain structures.
(1) Data Collection: Collect the test result data of each batch of office chair products submitted for inspection, including the production line of the sample, inspection date, product name, inspection conclusion, etc., to enable more comprehensive analysis. Ensure uniform formatting of inspection dates to facilitate subsequent time-series analysis.
(2) Data Preprocessing: Clean the collected data, and replace the inspection conclusions "nonconforming" and "conforming" with 1 and 0 respectively to facilitate subsequent analysis and modeling.
2. Data Processing and Analysis:
(1) Calculate the cumulative number of nonconforming products, nonconformity rate, maximum consecutive nonconforming occurrences and their proportion in the latest 100 tests.
(2) Establish a prediction and early warning model:
a. Quality Risk Score Calculation: $EMA_t = alpha imes Current_Risk_t + (1-alpha) imes EMA_{t-1}$; where the smoothing factor $alpha$ is set to 0.2. The current risk value at time t is calculated as: $Current_Risk_t = (Cumulative_Nonconformity_Rate_t imes 0.6) + (Proportion_of_Max_Consecutive_Nonconformities_t imes 0.4)$.
b. Trend Analysis: Trend Index = (Average EMA of the latest 10 periods - Average EMA of the previous 10 periods) / 10;
c. Comprehensive Risk Score: Comprehensive Risk Score = EMA + (Trend Index × Weight Factor), where the weight factor is set to 0.5.
d. Risk Level Determination: The risk level is defined as follows: Low risk when Comprehensive Risk Score ≤ 5; Medium risk when 5 < Comprehensive Risk Score ≤ 10; High risk when 10 < Comprehensive Risk Score ≤15; Extreme risk when Comprehensive Risk Score >15.
提供机构:
安吉县盛信办公家具有限公司
创建时间:
2024-10-25
搜集汇总
数据集介绍
特点
该数据集是一个用于评估办公椅产品质量风险的量化工具,包含501条记录,每季度更新一次。数据涵盖多个质量指标,通过特定算法计算风险评分,帮助企业优化生产流程和提高产品质量。
以上内容由遇见数据集搜集并总结生成


