
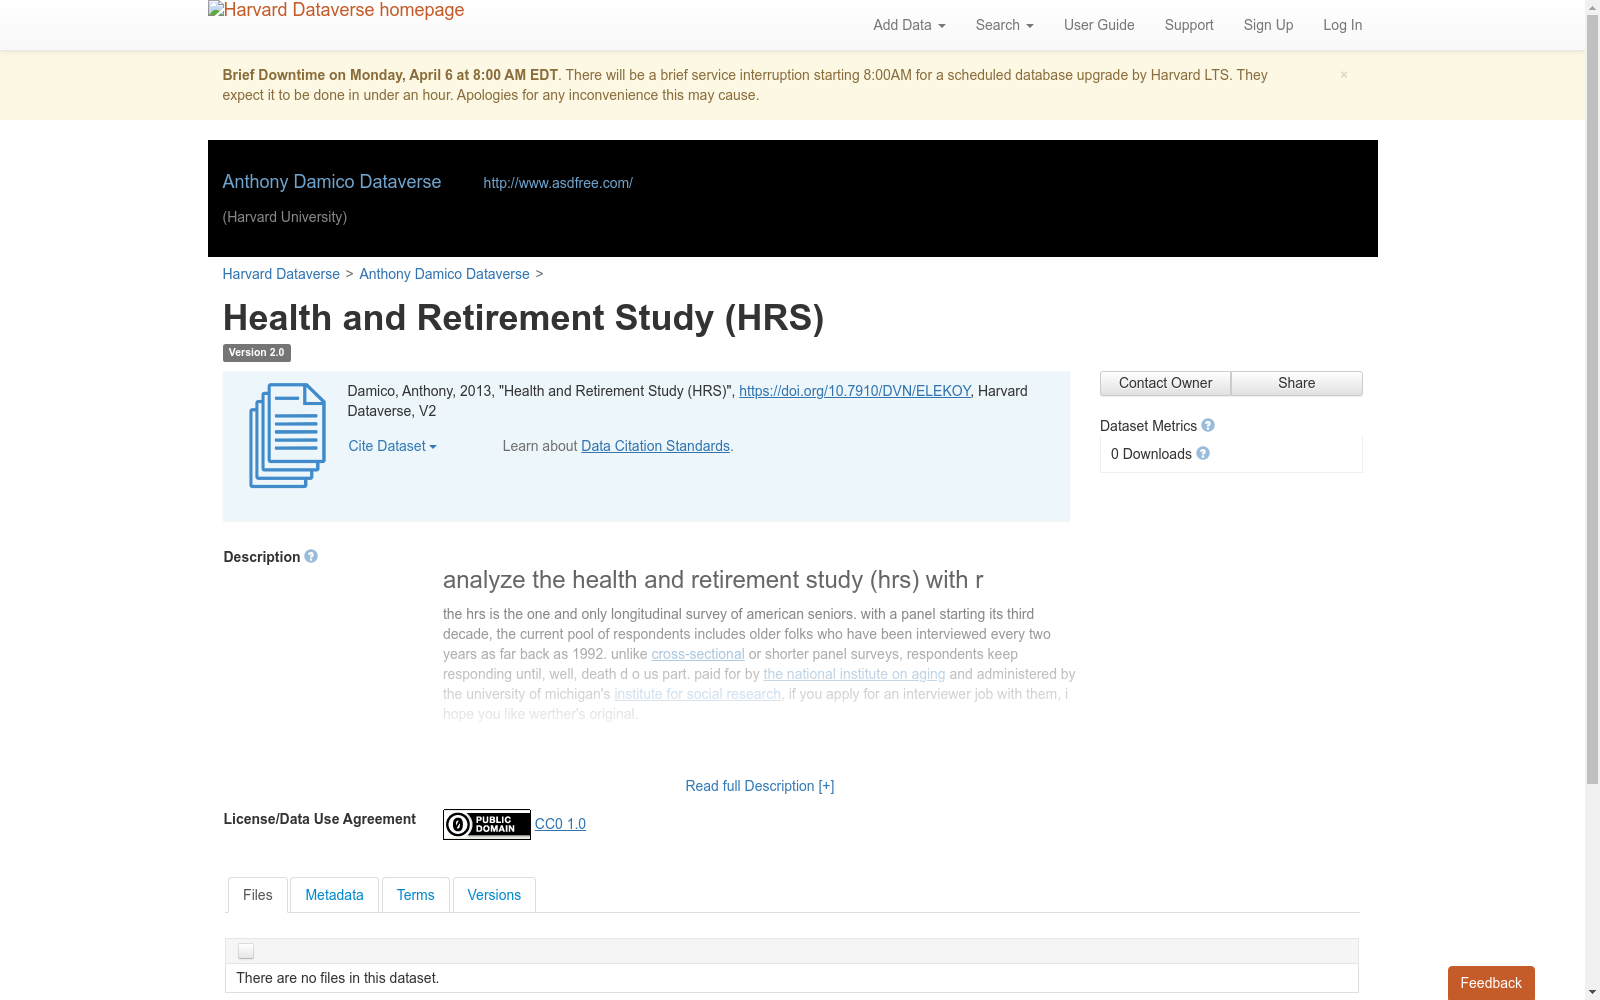
Health and Retirement Study (HRS)
收藏DataCite Commons2025-05-12 更新2025-05-17 收录
下载链接:
https://dataverse.harvard.edu/citation?persistentId=doi:10.7910/DVN/ELEKOY
下载链接
链接失效反馈官方服务:
资源简介:
<h3 class="post-title entry-title" itemprop="name"> analyze the health and retirement study (hrs) with r </h3> the hrs is the one and only longitudinal survey of american seniors. with a panel starting its third decade, the current pool of respondents includes older folks who have been interviewed every two years as far back as 1992. unlike <a href="http://en.wikipedia.org/wiki/Cross-sectional_study">cross-sectional</a> or shorter panel surveys, respondents keep responding until, well, death d
o us part. paid for by <a href="http://www.nia.nih.gov/">the national institute on aging</a> and administered by the university of michigan's <a href="http://www.isr.umich.edu/home/">institute for social research</a>, if you apply for an interviewer job with them, i hope you like werther's original.<br /> <br /> figuring out how to analyze this data set might trigger your <a href="http://en.wikipedia.org/wiki/Fight-or-flight_response">fight-or-flight</a> synapses if you just start clicking arou
nd on michigan's website. instead, read pages numbered 10-17 (pdf pages 12-19) of
<a href="http://hrsonline.isr.umich.edu/sitedocs/databook/HRS_Text_WEB_intro.pdf">this introduction pdf</a> and don't touch the data until you understand figure a-3 on that last page. if you start enjoying yourself, here's <a href="http://hrsonline.isr.umich.edu/index.php?p=dbook">the whole book</a>. after that, it's time to <a href="https://ssl.isr.umich.edu/hrs/reg_pub2.php">register</a> for access to the (free) data. keep your username and password handy, you'll need it for the top of the
download automation r script. next, look at this <a href="http://hrsonline.isr.umich.edu/index.php?p=dflow">data flowchart</a> to get an idea of why the <a href="https://ssl.isr.umich.edu/hrs/files2.php">data download</a> page is such a righteous jungle. but wait, good news: umich recently farmed out its data management to <a href="http://www.rand.org/">the rand corporation</a>, who promptly constructed <a href="http://www.rand.org/labor/aging/dataprod.html">a giant consolidated file</a> with
one record per respondent across the whole panel. oh so beautiful. the rand hrs
files make much of the older data and syntax examples obsolete, so when you come across stuff like
<a href="http://hrsonline.isr.umich.edu/sitedocs/dmgt/ElementaryCookbook.pdf">instructions on how to merge years</a>, you can happily ignore them - rand has done it for you.<br /> <br /> the health and retirement study only includes noninstitutionalized adults when new respondents get added to the panel (as they were in <a href="http://hrsonline.isr.umich.edu/index.php?p=howsite&amp;jumpfrom=HG">1992, 1993, 1998, 2004, and 2010</a>) but once they're in, they're in - respondents have a weight of
zero for interview waves when they were nursing home residents; but they're still responding and will continue to contribute to your statistics so long as you're generalizing about a population from a previous wave (for example: it's possible to compute "among all americans who were 50+ years old in 1998, x% lived in nursing homes by 2010"). my source for that 411?
<a href="http://hrsonline.isr.umich.edu/sitedocs/surveydesign.pdf">page 13 of the design doc</a>. wicked. this new github repository contains five scripts:<br /> <br /> <br /> <b>1992 - 2010 download HRS microdata.R</b><br /> <ul> <li>loop through every year and every file, <a href="http://www.inside-r.org/packages/cran/httr/docs/GET">download</a>, then <a href="http://stat.ethz.ch/R-manual/R-devel/library/utils/html/unzip.html">unzip</a> everything in one big party </li> </ul> <br /> <b>impor
t longitudinal RAND contributed files.R</b><br /> <ul> <li>create a <a href="http://cran.r-project.org/web/packages/RSQLite/RSQLite.pdf">SQLite</a> database (.db) on the local disk</li> <li>load the rand, rand-cams, and both rand-family files into the database (.db) in chunks (to prevent overloading ram)</li> </ul> <br /> <b>longitudinal RAND - analysis examples.R</b><br /> <ul> <li>connect to the sql database created by the 'import longitudinal RAND contributed files' program</li> <li>create tw
o <a href="http://faculty.washington.edu/tlumley/survey/svy-dbi.html">database-backed</a> complex sample survey object, using a <a href="http://faculty.washington.edu/tlumley/survey/html/svydesign.html">taylor-series linearization design</a></li> <li>perform a mountain of analysis examples with wave weights from two different points in the panel</li> </ul> <br /> <b>import example HRS file.R</b><br /> <ul> <li>load a fixed-width file using only the sas importation script directly into ram with <
a href="http://blog.revolutionanalytics.com/2012/07/importing-public-data-with-sas-instructions-into-r.html">SAScii
</a></li> <li>parse through the IF block at the bottom of the sas importation script, blank out a number of variables</li> <li><a href="http://stat.ethz.ch/R-manual/R-patched/library/base/html/save.html">save</a> the file as an R data file (.rda) for fast loading later</li> </ul> <br /> <b>replicate 2002 regression.R</b><br /> <ul> <li>connect to the sql database created by the 'import longitudinal RAND contributed files' program</li> <li>create a <a href="http://faculty.washington.edu/tlumley/s
urvey/svy-dbi.html">database-backed</a> complex sample survey object, using a <a href="http://faculty.washington.edu/tlumley/survey/html/svydesign.html">taylor-series linearization design</a></li> <li>exactly match the final regression shown in <a href="https://github.com/ajdamico/usgsd/blob/master/Health%20and%20Retirement%20Study/HRS%20stata%20output%20on%20current%20data%20from%20RAND.pdf?raw=true">this document</a> provided by analysts at RAND as an update of the regression on <a href="http:
//hrsonline.isr.umich.edu/sitedocs/dmgt/IntroUserGuide.pdf">pdf page B76 of this document
</a>.</li> </ul> <br /> <br /> <br /> <a href="https://github.com/ajdamico/usgsd/tree/master/Health%20and%20Retirement%20Study">click here to view these five scripts</a><br /> <br /> <br /> <br /> for more detail about the health and retirement study (hrs), visit:<br /> <ul> <li><a href="http://hrsonline.isr.umich.edu/">michigan's hrs homepage</a></li> <li><a href="http://hrsonline.isr.umich.edu/modules/meta/rand/index.html">rand's hrs homepage</a></li> <li><a href="http://en.wikipedia.org/wiki/
Health_and_Retirement_Study">the hrs wikipedia page</a> </li> <li><a href="http://hrsonline.isr.umich.edu/index.php?p=pubs">a running list of publications using hrs</a></li> </ul> <br /> notes:<br /> <br /> exemplary work making it this far. as a reward, here's <a href="http://hrsonline.isr.umich.edu/modules/meta/rand/randhrsl/randhrsL.pdf">the detailed codebook for the main rand hrs file</a>. note that rand also creates 'flat files' for every survey wave, but really, most every analysis you c
an think of is possible using just the four files imported with the rand importation script above. if you must work with the non-rand files, there's an example of how to import a single hrs (umich-created) file, but if you wish to import more than one, you'll have to write some
<a href="http://www.screenr.com/WgH8">for loops</a> yourself. <br /> <br /> <br /> confidential to sas, spss, stata, and sudaan users: a tidal wave is coming. you can get water up your nose and be dragged out to sea, or you can grab a surf board. time to transition to r. :D <br /> <br />
<h3 class="post-title entry-title" itemprop="name"> 使用R语言分析健康与退休研究(Health and Retirement Study, HRS)</h3> 健康与退休研究(HRS)是全美唯一针对老年群体的纵向追踪调查。该追踪面板已进入第三个十年,当前受访对象群体涵盖了自1992年起每两年接受一次访谈的老年受访者。与<a href="http://en.wikipedia.org/wiki/Cross-sectional_study">横断面研究(cross-sectional study)</a>或短期追踪调查不同,受访者将持续参与调研直至离世。<br /><br />该研究由美国国家衰老研究所(National Institute on Aging, NIA)资助,密歇根大学社会研究所(Institute for Social Research, ISR)负责执行。若你申请该机构的访员职位,祝你喜欢沃斯经典(Werther's Original)糖果。<br /><br />若你刚在密歇根大学的官网中摸索如何分析该数据集,可能会触发你的战斗或逃跑反应(fight-or-flight response)。反之,你可以先阅读这份介绍PDF的第10-17页(对应PDF页码12-19),在理解最后一页的图A-3前,请勿直接操作数据集。若你渐入佳境,可查阅完整手册。<br /><br />完成上述步骤后,你需要注册以获取免费数据集权限,请妥善保管你的用户名与密码,后续的自动化下载R脚本中会用到。接下来,你可以查看这份数据流程图,以理解为何数据下载页面会如同错综复杂的丛林。<br /><br />不过好消息是:密歇根大学近期将数据管理工作外包给了兰德公司(Rand Corporation),后者很快便构建了一份整合度极高的数据集,其中针对整个追踪面板的每位受访者仅保留一条记录,堪称完美。<br /><br />兰德公司的HRS数据集已使大量旧版数据与语法示例失效,因此当你遇到诸如年度数据合并指南这类内容时,可直接忽略——兰德公司已替你完成了数据合并工作。<br /><br />健康与退休研究在新增追踪受访者时,仅纳入非机构化居住的成年人(1992、1993、1998、2004与2010年的新增样本均遵循此规则);但一旦受访者加入面板,便会持续参与:若受访者在某一轮访谈中处于疗养院居住状态,则该轮访谈的权重为0,但他们仍会保留在样本中,且在你基于过往访谈波次的群体进行推断时,仍会贡献统计数据。例如,你可以计算“1998年时年龄≥50岁的美国人群中,至2010年有X%居住在疗养院”这类结果。我关于此规则的信息来源为研究设计文档第13页,十分详尽。<br /><br />本GitHub仓库共包含5个R脚本:<br /><br /><br /><b>1992-2010 download HRS microdata.R</b><br /><ul><li>遍历所有年份与文件,使用httr包的GET函数下载数据,再通过unzip工具批量解压所有文件</li></ul><br /><b>import longitudinal RAND contributed files.R</b><br /><ul><li>在本地磁盘创建SQLite数据库(.db格式)</li><li>分批次将兰德公司提供的HRS、rand-cams及所有兰德家族数据集导入数据库,以避免内存过载</li></ul><br /><b>longitudinal RAND - analysis examples.R</b><br /><ul><li>连接由“import longitudinal RAND contributed files”脚本创建的SQL数据库</li><li>使用泰勒级数线性化设计,创建两个基于数据库的复杂抽样调查对象</li><li>基于追踪面板中两个不同波次的权重,开展大量分析示例演示</li></ul><br /><b>import example HRS file.R</b><br /><ul><li>通过SAScii工具,直接基于SAS导入脚本将固定宽度格式的文件加载至内存</li><li>解析SAS导入脚本底部的IF条件块,清空部分变量</li><li>将处理后的文件保存为R数据格式文件(.rda),以便后续快速加载</li></ul><br /><b>replicate 2002 regression.R</b><br /><ul><li>连接由“import longitudinal RAND contributed files”脚本创建的SQL数据库</li><li>使用泰勒级数线性化设计,创建一个基于数据库的复杂抽样调查对象</li><li>精准复现兰德公司分析师提供的文档中展示的最终回归结果,该文档是对原文档PDF第B76页中回归分析的更新版本。</li></ul><br /><br /><br /><a href="https://github.com/ajdamico/usgsd/tree/master/Health%20and%20Retirement%20Study">点击此处查看这5个R脚本</a><br /><br /><br /><br />若需了解健康与退休研究(HRS)的更多细节,可访问以下链接:<br /><ul><li><a href="http://hrsonline.isr.umich.edu/">密歇根大学HRS官方主页</a></li><li><a href="http://hrsonline.isr.umich.edu/modules/meta/rand/index.html">兰德公司HRS官方主页</a></li><li><a href="http://en.wikipedia.org/wiki/Health_and_Retirement_Study">HRS维基百科页面</a></li><li><a href="http://hrsonline.isr.umich.edu/index.php?p=pubs">HRS相关研究论文持续更新列表</a></li></ul><br />备注:<br /><br />能看到此处已是很棒的进展。作为奖励,你可以查阅兰德公司主HRS数据集的详细代码手册。请注意,兰德公司还为每一轮调查创建了“扁平文件”,但实际上,仅通过上述兰德公司导入脚本加载的4个文件,便可完成你能想到的绝大多数分析工作。若你必须使用非兰德公司的数据集,这里有导入单份密歇根大学生成的HRS文件的示例,但如果你需要导入多份文件,则需要自行编写for循环语句。<br /><br /><br />致SAS、SPSS、Stata与SUDAAN用户:一场数据浪潮即将来袭。你要么被呛水并被卷向深海,要么拿起冲浪板顺势而为——是时候转向R语言了。:D
提供机构:
Harvard Dataverse
创建时间:
2019-02-13
搜集汇总
数据集介绍
背景与挑战
背景概述
Health and Retirement Study (HRS)是一个长期跟踪调查数据集,专注于美国老年人的健康和退休状况,数据从1992年开始收集。数据集由RAND公司整合,提供了简化的数据分析流程。
以上内容由遇见数据集搜集并总结生成



