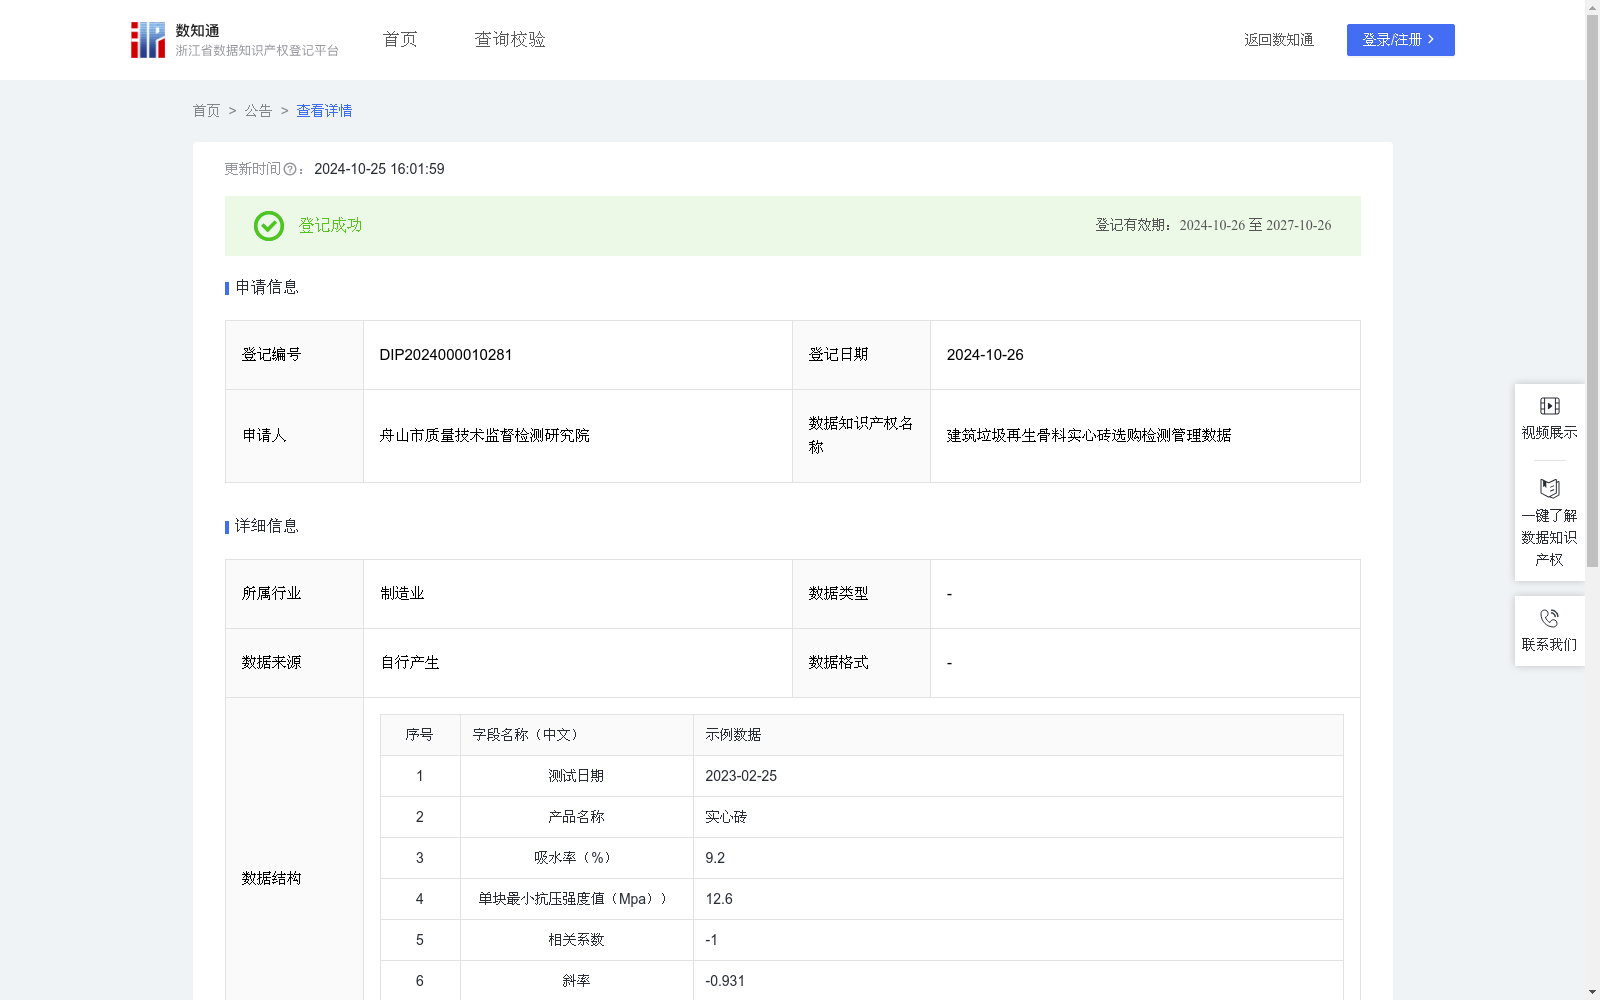
建筑垃圾再生骨料实心砖选购检测管理数据
收藏浙江省数据知识产权登记平台2024-10-25 更新2024-10-26 收录
下载链接:
https://www.zjip.org.cn/home/announce/trends/75801
下载链接
链接失效反馈官方服务:
资源简介:
相关系数是衡量两个变量之间线性关系强度和方向的统计指标。斜率和截距是线性回归方程的核心参数,两者共同决定了回归直线在坐标系中的位置和倾斜程度,有助于数据分析和预测。通过对实心砖产品的单块最小抗压强度值和吸水率的测试数据进行长期积累,并持续计算它们之间的相关系数、斜率和截距,具有重要的实际意义。随着数据规模的不断扩大,相关系数、斜率和截距的计算结果将更加精确和可靠。这些数据可供实心砖领域的科研工作者、技术研发人员、质量管理人员、产品检验人员等使用,基于吸水率预测实心砖的抗压强度,辅助产品性能评估。识别抗压强度与吸水率之间的变化趋势,指导生产工艺优化。探讨吸水率对抗压强度的具体影响机制,促进材料科学研究。通过系统地分析单块最小抗压强度值与吸水率之间的关系,可以全面提升实心砖产品的研发水平和质量管理能力,进而满足市场需求并推动行业发展。1. 数据采集和预处理:(1)数据采集: 采集实心砖产品的测试结果数据,包括测试日期、具体产品名称、吸水率、单块最小抗压强度值。(2)数据预处理: 对采集的数据进行清洗,去除重复、错误或无关的信息,以确保数据的准确性和一致性,便于后续的加工和分析。2. 数据加工和分析:(1)计算相关系数:将历史采集的吸水率和单块最小抗压强度值数据以及本次测试的数据汇总,形成两个变量集合X(吸水率)和Y(抗压强度)。利用CORREL函数计算变量集合X和Y之间的相关系数。具体公式为:相关系数= Cov(X,Y)/(SX*SY),其中,Cov(X,Y) 为X和Y的协方差,SX和 SY分别为X和Y的标准差。(2)计算斜率和截距:使用LOGEST函数,对变量集合X(吸水率)和Y(抗压强度)进行自然对数转换,运用指数回归分析方法,精确计算描述变量集合X和Y之间指数关系的斜率和截距。
The correlation coefficient is a statistical metric that quantifies the strength and direction of the linear relationship between two variables. Slope and intercept are core parameters of the linear regression equation; together, they determine the position and inclination of the regression line in the coordinate system, facilitating data analysis and prediction. It holds great practical significance to accumulate long-term test data on the minimum single-brick compressive strength and water absorption rate of solid brick products, and continuously compute the correlation coefficient, slope and intercept between the two metrics. As the dataset scale expands, the calculation results of correlation coefficient, slope and intercept will become increasingly accurate and reliable.
This dataset is accessible to researchers, technical R&D staff, quality management personnel, product inspectors and other stakeholders in the solid brick industry. It can be used to predict the compressive strength of solid bricks based on their water absorption rate to support product performance evaluation, identify the changing trends between compressive strength and water absorption rate to guide production process optimization, explore the specific mechanisms through which water absorption rate affects compressive strength, and advance materials science research. By systematically analyzing the relationship between minimum single-brick compressive strength and water absorption rate, the R&D level and quality management capabilities of solid brick products can be comprehensively enhanced, thereby meeting market demand and promoting industry development.
1. Data Collection and Preprocessing
(1) Data Collection: Collect test result data of solid brick products, including test date, specific product name, water absorption rate, and minimum single-brick compressive strength.
(2) Data Preprocessing: Clean the collected data by removing duplicate, erroneous or irrelevant entries to ensure data accuracy and consistency, and facilitate subsequent processing and analysis.
2. Data Processing and Analysis
(1) Calculation of Correlation Coefficient: Aggregate historically collected data on water absorption rate and minimum single-brick compressive strength, along with data from the current test, to form two variable sets: X (water absorption rate) and Y (compressive strength). Use the CORREL function to compute the correlation coefficient between sets X and Y. The specific formula is:
Correlation Coefficient = Cov(X,Y)/(S_X * S_Y),
where Cov(X,Y) denotes the covariance of X and Y, and S_X and S_Y represent the standard deviations of X and Y, respectively.
(2) Calculation of Slope and Intercept: Utilize the LOGEST function, apply natural logarithmic transformation to variable sets X (water absorption rate) and Y (compressive strength), and employ exponential regression analysis to accurately calculate the slope and intercept that describe the exponential relationship between sets X and Y.
提供机构:
舟山市质量技术监督检测研究院
创建时间:
2024-09-27
搜集汇总
数据集介绍
以上内容由遇见数据集搜集并总结生成


