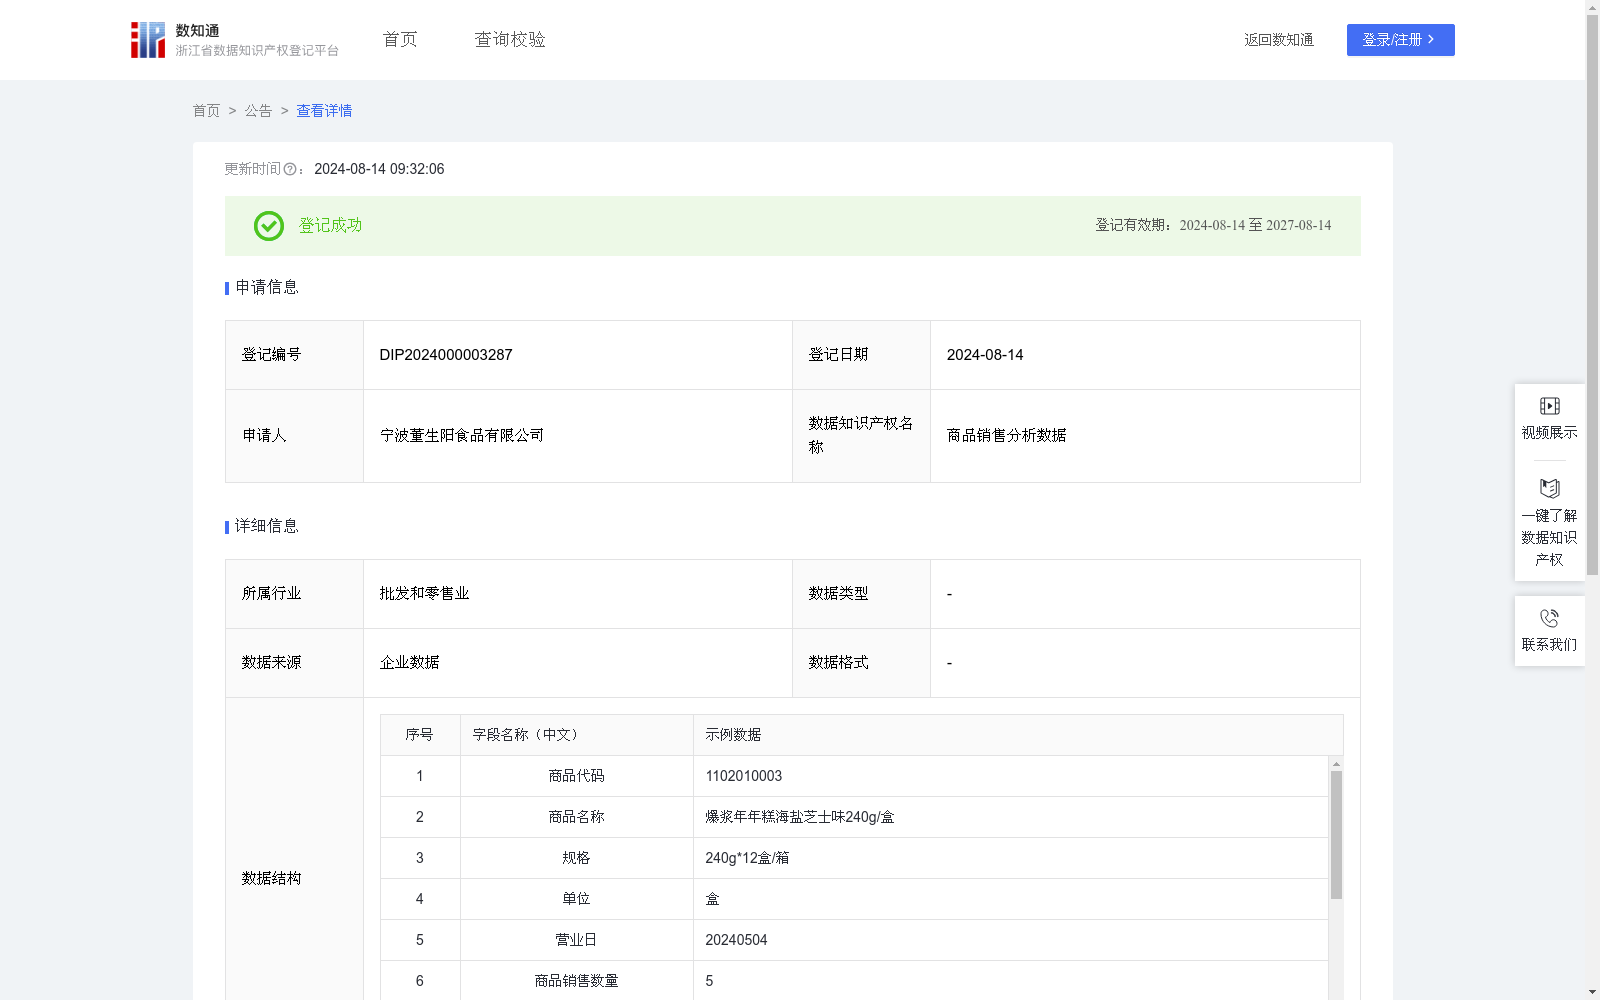
商品销售分析数据
收藏浙江省数据知识产权登记平台2024-08-14 更新2024-08-15 收录
下载链接:
https://www.zjip.org.cn/home/announce/trends/50464
下载链接
链接失效反馈官方服务:
资源简介:
零食行业的消费者偏好多变,口味和需求更新迅速。通过处理乐檬系统中导出的数据,分析不同商品的销售表现,企业可以识别出哪些零食品类或特定产品受到消费者的青睐,哪些则逐渐失去市场。通过优化产品组合,及时调整策略,增加热门产品的供应,同时淘汰那些不再受欢迎的零食,有助于提高销售额和库存周转率。零售数据可以在乐檬商业零售系统中导出,但是由于数据比较庞杂,需要人工进行进一步处理才能得到所需的商品销售数据,故采用一定算法计算得到所有销售终端每月的销售情况 。采集商品订单数据,编写代码处理获取所需数据。商品销售金额:通过订单数据根据商品代码汇总商品实际支付金额;销售数量:通过订单数据根据商品代码汇总商品实际支付;商品销售单价:商品销售金额/商品销售数量;商品销售金额占比:商品销售金额 / 商品总销售金额;商品销售次数:收银销售单中含有选定商品的订单数量;商品销售次数占比:商品销售次数 / 所有商品的商品销售次数;客单量:通过订单数据根据商品代码汇总订单号,获取去重订单数;客单价:商品销售金额/客单量;连带率:商品销售数量 / 客单数。根据以上数据,建立商品末位淘汰制,淘汰低销量,低占比商品,调整对应商品策略。
Consumer preferences in the snack industry are highly volatile, with tastes and demands updating rapidly. By processing data exported from the Lemeng Commercial Retail System and analyzing the sales performance of different products, enterprises can identify which snack categories or specific products are favored by consumers and which are gradually losing market share. Optimizing product portfolios, adjusting strategies in a timely manner, increasing the supply of popular products, and eliminating snacks that are no longer popular can help improve sales revenue and inventory turnover rate. Retail data can be exported from the Lemeng Commercial Retail System. However, due to the complexity of the raw data, manual further processing is required to obtain the required product sales data. Therefore, certain algorithms are adopted to calculate the monthly sales performance of all sales terminals. Product order data is collected and code is written to process and obtain the required data. Specific sales metrics are calculated as follows: 1. Product sales amount: total actual payment amount of products aggregated based on product codes from order data; 2. Sales quantity: total actual sales quantity of products aggregated based on product codes from order data; 3. Average unit sales price: total product sales amount / total sales quantity of the product; 4. Proportion of product sales amount: product sales amount / total sales amount of all products; 5. Sales frequency: number of orders containing the selected product in cashier sales receipts; 6. Proportion of sales frequency: product sales frequency / total sales frequency of all products; 7. Customer transaction count: number of unique orders obtained by aggregating order numbers based on product codes from order data; 8. Average customer transaction value: total product sales amount / customer transaction count; 9. Associated purchase rate: total product sales quantity / number of unique customer orders. Based on the above data, enterprises can establish a product bottom elimination mechanism to eliminate products with low sales volume and low proportion, and adjust corresponding product strategies.
提供机构:
宁波董生阳食品有限公司
创建时间:
2024-07-15
搜集汇总
数据集介绍
特点
该数据集包含宁波董生阳食品有限公司的商品销售数据,共659条记录,每月更新,涵盖14个销售指标字段,用于零食行业的销售分析和产品优化。
以上内容由遇见数据集搜集并总结生成


