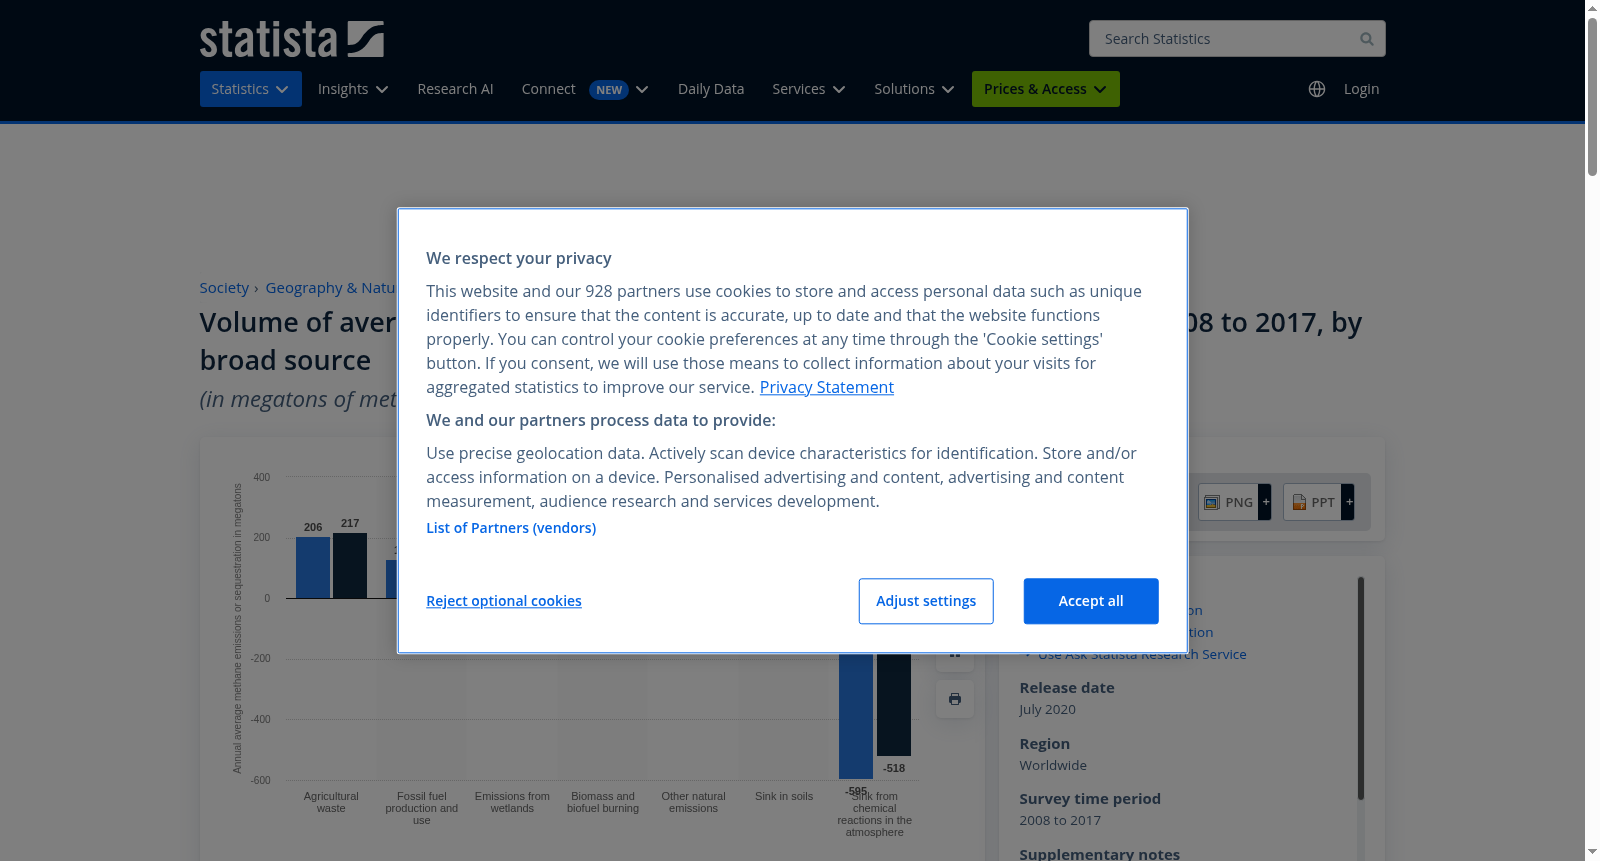
Global annual methane emissions and sinks 2008-2017, by source
收藏www.statista.com2024-08-09 更新2025-03-26 收录
下载链接:
https://www.statista.com/statistics/1349794/global-methane-emissions-sinks-source/
下载链接
链接失效反馈官方服务:
资源简介:
Based on estimated annual averages from 2008 to 2017, human-made and natural fluxes in emissions release between 576 and 737 megatons (million tons) of methane into the atmosphere each year, while chemical reactions in the atmosphere and sequestration into the soil absorbs between 556 and 625 megatons of methane, meaning that there is a surplus of methane emitted into our atmosphere each year. Precise figures for this surplus are difficult to quantify, as both the bottom-up and top-down estimates for each source are the mid-values of estimate ranges, however the Global Carbon Project gave a bottom-up estimate of over 100 megatons per year, and a top down estimate of around 13 megatons per year.Comparison with carbon dioxideWhile the figures for methane are well below the volume of excess carbon dioxide (CO2) released into the atmosphere, - around 5,100 megatons (or 5.1 gigatons) per year in the 2010s - methane has a much higher impact on climate change when both quantities are the same. Based on their global warming potential (GWP), which assesses greenhouses gases on their ability to trap heat in the atmosphere compared to CO2, methane has a GWP of 70-80 over a 20 year period, meaning that one ton of methane in the atmosphere would trap the same amount of heat as 70-80 tons of CO2 over a 20 year period.Methane's GWP falls to around 25-30 over a 100 year period, due to variations in the length of time each greenhouse remains in the atmosphere, however the immediacy of the threat posed by climate change means that methane emissions should not be ignored. For example, if the upper estimate of 100 megatons of surplus methane is correct, then this has the potential to trap the same amount of heat as 80,000 megatons of CO2 over a 20 year period, which is over 15 times higher than the actual figure.
基于2008年至2017年估算的年度平均值,人为与自然排放的甲烷通量每年介于576至737百万吨之间,而大气中的化学反应及土壤中的封存作用每年吸收的甲烷量介于556至625百万吨。这意味着每年向大气中排放的甲烷均有盈余。由于每个来源的底向上和顶向下的估计值均为估计范围的中间值,因此该盈余的确切数字难以量化。然而,全球碳项目给出了底向上的年度估计值超过100百万吨,以及顶向下的年度估计值约13百万吨。与二氧化碳的对比尽管甲烷的数值远低于大气中过量二氧化碳(CO2)的排放量——在2010年代,这一数值约为每年5,100百万吨(或5.1吉吨),但甲烷在相同数量下对气候变化的影响更为显著。根据其全球变暖潜力(GWP),该指标评估温室气体相对于二氧化碳在大气中捕获热量的能力,甲烷在20年内的GWP为70-80,意味着大气中的一吨甲烷会捕获与70-80吨二氧化碳相当的热量。由于每种温室气体在大气中停留时间的差异,甲烷的GWP在100年内降至约25-30,然而,鉴于气候变化带来的即时威胁,甲烷排放不容忽视。例如,如果100百万吨过剩甲烷的上限估计值正确,那么在20年内它能够捕获的热量相当于80,000百万吨二氧化碳,这比实际数值高出超过15倍。
提供机构:
Statista
搜集汇总
数据集介绍
背景与挑战
背景概述
该数据集展示了2008-2017年全球甲烷排放和吸收的年度平均值,按农业废弃物、化石燃料生产和使用等来源分类,并提供了两种估算方法的结果。数据突显了甲烷排放对气候变化的潜在高影响,尽管其排放量低于二氧化碳。
以上内容由遇见数据集搜集并总结生成


