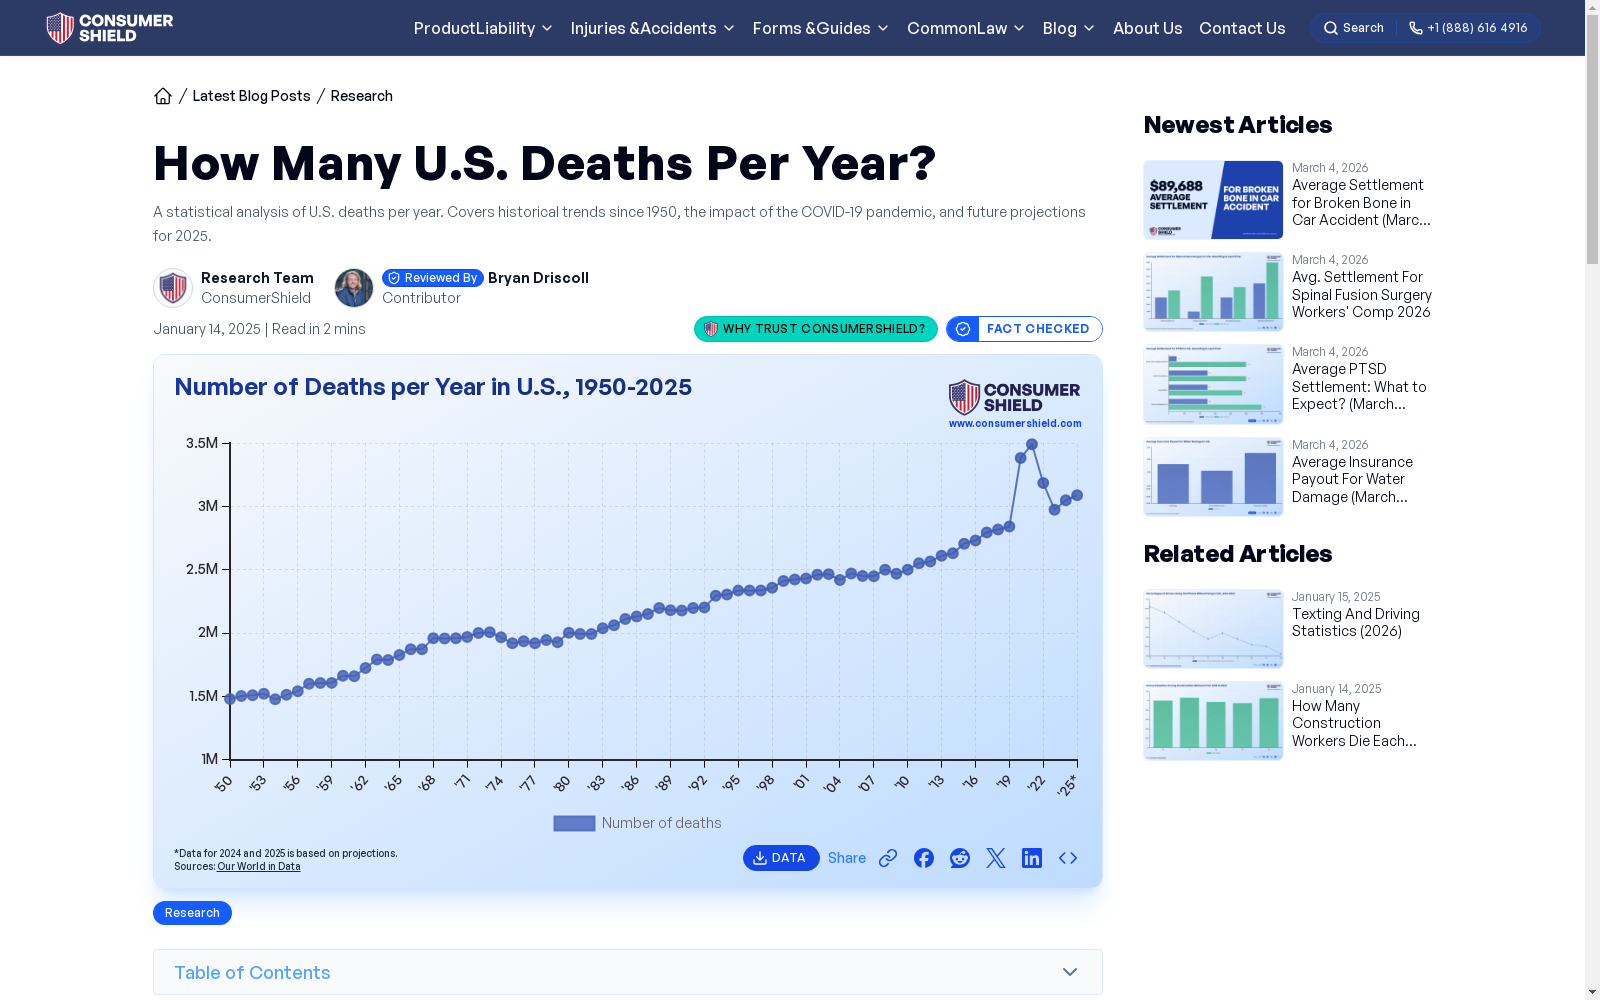
Number of Deaths per Year in U.S., 1950-2024
收藏资源简介:
The graph displays the number of deaths per year in the United States from 1950 to 2024. The x-axis represents the years, abbreviated from '50 to '24, while the y-axis indicates the annual number of deaths. Over this 75-year period, the number of deaths ranges from a low of 1,479,684 in 1950 to a high of 3,492,879 in 2021. Notable figures include 2,430,923 deaths in 2001 and 3,046,572 projected deaths in 2024. The data exhibits a general upward trend in annual deaths over the decades, with significant increases in recent years. This information is presented in a line graph format, effectively highlighting the long-term trends and yearly variations in deaths across the United States.
本图表展现了自1950年至2024年美国每年死亡人数的统计数据。横轴以年份为基准,从'50简略至'24,纵轴则标示每年死亡人数。在长达75年的时间跨度内,死亡人数介于1950年的最低点1,479,684至2021年的最高点3,492,879之间。值得关注的数据点包括2001年的2,430,923人死亡以及2024年预计的3,046,572人死亡。数据呈现出年度死亡人数随年代递增的总体趋势,近年来增幅尤为显著。该信息以折线图的形式呈现,有效地突显了美国死亡人数的长期趋势和年度波动。