2000-2019年全国三大粮食作物1km种植分布数据集
收藏国家生态科学数据中心2024-03-04 收录
下载链接:
http://www.nesdc.org.cn/sdo/detail?id=627dfc4b7e28172589c2df9b
下载链接
链接失效反馈官方服务:
资源简介:
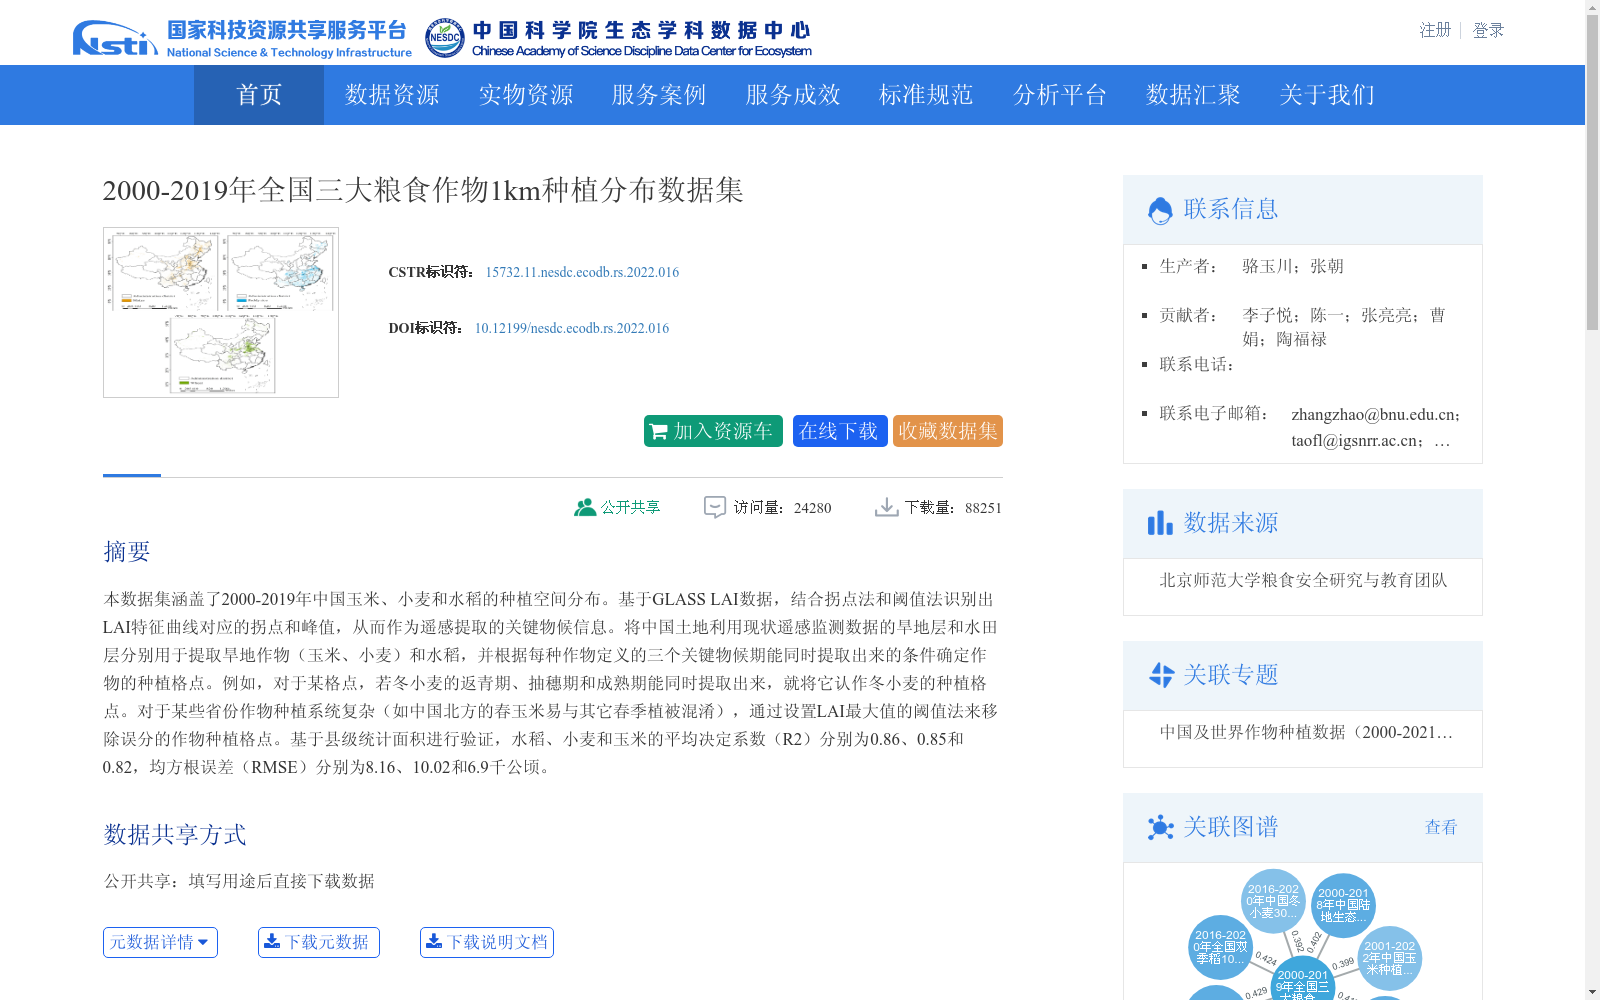
本数据集涵盖了2000-2019年中国玉米、小麦和水稻的种植空间分布。基于GLASS LAI数据,结合拐点法和阈值法识别出LAI特征曲线对应的拐点和峰值,从而作为遥感提取的关键物候信息。将中国土地利用现状遥感监测数据的旱地层和水田层分别用于提取旱地作物(玉米、小麦)和水稻,并根据每种作物定义的三个关键物候期能同时提取出来的条件确定作物的种植格点。例如,对于某格点,若冬小麦的返青期、抽穗期和成熟期能同时提取出来,就将它认作冬小麦的种植格点。对于某些省份作物种植系统复杂(如中国北方的春玉米易与其它春季植被混淆),通过设置LAI最大值的阈值法来移除误分的作物种植格点。基于县级统计面积进行验证,水稻、小麦和玉米的平均决定系数(R2)分别为0.86、0.85和0.82,均方根误差(RMSE)分别为8.16、10.02和6.9千公顷。
This dataset contains the spatial distribution patterns of maize, wheat and rice cultivation in China during the period 2000–2019. Using the GLASS LAI data, the inflection points and peak values of LAI characteristic curves were identified via the inflection point method and threshold method, which were taken as the key phenological information extracted through remote sensing. The dryland layer and paddy field layer from the Remote Sensing Monitoring Data of Land Use Status in China were respectively utilized to extract dryland crops (maize and wheat) and rice. Cultivation grid points were determined based on the prerequisite that all three key phenological periods defined for a given crop could be successfully extracted. For example, for a given grid point, if the green-up stage, heading stage and maturity stage of winter wheat can all be successfully extracted, this grid point will be identified as a winter wheat cultivation grid point. For provinces with complex cropping systems (e.g., spring maize in northern China, which is easily confused with other spring vegetation), a threshold method based on the maximum LAI value was applied to eliminate misclassified crop cultivation grid points. Validation was conducted based on county-level statistical acreage data. The average determination coefficients (R²) for rice, wheat and maize were 0.86, 0.85 and 0.82, respectively, with corresponding root mean square errors (RMSE) of 8.16, 10.02 and 6.9 thousand hectares, respectively.
提供机构:
团队
创建时间:
2021-09-30
搜集汇总
数据集介绍
背景与挑战
背景概述
该数据集提供了2000年至2019年中国玉米、小麦和水稻三大粮食作物的1公里分辨率种植空间分布信息。它基于GLASS LAI遥感数据,采用拐点法和阈值法提取作物关键物候期进行识别,并利用县级统计面积验证,水稻、小麦和玉米的平均决定系数(R2)分别为0.86、0.85和0.82,数据精度较高。数据集以栅格图像格式存储,总量约959.80MB,适用于农业布局、粮食安全及气候变化等相关研究。
以上内容由遇见数据集搜集并总结生成


